

Copyrights: Jamileh Abolghasemi, Mohsen Nasiri Toosi, Mahboobeh Rasouli, Hajar Taslimi, 2018. License: This work is licensed under a Creative Commons Attribution 4.0 International License.
Abstract
Introduction: Liver transplantation is known as the only treatment for advanced liver cirrhosis. Considering the importance of identifying the factors affecting the survival of cirrhosis patients after transplantation in order to improve the health of these patients and increase their longevity, this study was conducted to fit the best accelerated failure time model for survival analysis of cirrhosis patients.
Methods: This descriptive-analytical study was conducted by collecting the information about 563 patients with liver cirrhosis who underwent liver transplantation in Imam Khomeini Hospital during 2002-2013 and were followed up for at least 5 years. The data were analyzed using Chisquare test, ANOVA, and Kaplan-Meier non-parametric method as well as exponential Accelerated Failure Time, Weibull, Log-Normal, and Log-Logistic survival models.
Results: During the study, 92 (16.3%) of the 563 patients under study died and 165 (29.3%) of them suffered liver transplant rejection. The one-year, three-year, and five-year survival of the patients after transplantation was 0.804, 0.653, and 0.420, respectively. Among the fitted Accelerated Failure Time models, the fitted log-logistic model was the most effective (P-value < 0.001). The effective variables in the Multiple regression log-logistic model included bilirubin (P-value < 0.001), INR (P-value < 0.001), creatinine (P-value < 0.001), and white blood cell (P-value = 0.011) logarithms.
Conclusion: Regarding the results of the study, bilirubin, INR, creatinine, and white blood cell logarithmic variables were effective in the survival analysis of the patients after liver transplantation. The survival of these patients can be enhanced through necessary care to maximally control these variables.
Introduction
The liver is the largest gland which performs various vital functions in the body and plays a major role in maintaining health by changing absorbed food and eliminating toxins. It is responsible for a variety of functions including regulating glucose metabolism, producing and secreting bile for digestion and absorption of fats from the digestive system, producing the proteins required by blood plasma, and removing metabolism waste from the blood and secreting it into the bile. Liver cirrhosis is a serious and progressive disorder, which is the liver's response to the lesions occurring to it, where some fibrosis appears in the liver due to chronic liver diseases. Liver fibrosis is an overgrowth of collagen, which causes a change in the shape of the liver in patients with cirrhosis. These changes will lead to pressure on the blood vessels of the liver and its small pores 1.
In advanced cases, the only definitive cure for liver cirrhosis is liver transplantation (LT) 234. The first human liver transplantation was performed in the United States in 1963 by a surgical team led by Thomas Starzl. Also, the first liver transplantation in Iran was undertaken in 1993 by Malek Hosseini in Namazi Hospital, Shiraz 5.
The two major problems that may occur to a patient after LT are liver rejection and infection. Immunosuppressive drugs are prescribed and used to prevent liver transplant rejection. These drugs slow down or stop the immune system to prevent it from the rejection of the new liver. Further, the patient is at high risk for infections, though this problem will decrease over time. A high percentage of patients undergoing LT do not experience infection and in turn, do not suffer from liver transplant rejection. Most infections can be successfully treated 67.
Liver cirrhosis is one of the most common causes of death from digestive diseases. Due to the shortage of donated liver and the high cost of LT, survival analysis of liver cirrhosis patients after transplantation is important, and the aim of this study was to determine the factors affecting the survival of the patients after LT 8.
Methods
In this survival study, the data were collected from 563 patients with liver cirrhosis who had undergone LT in Imam Khomeini Hospital, Tehran, from January 2002 to February 2013. They had been followed up for at least five years.
There were two groups of variables: demographic variables including age of entering the study, sex, education, smoking, use of alcohol and drugs, and cause of cirrhosis; and diagnostic and laboratory variables including MELD, Child, blood factors of bilirubin, INR, creatinine, and white blood cell count.
In most medical studies, one of the important variables is the time required for a specific event to occur, which is called failure time or survival time. To determine the survival time, three basic elements of the start point, determination of the time tracking scale and the eventual event should also be clearly defined. One of the main reasons why common statistical methods such as simple linear regression cannot be used in survival data is the asymmetric distribution of survival data. The other characteristic of survival data is the existence of censored observations.
In most medical studies, the semi-parametric Cox model is the most commonly used regression model in survival analysis. Nevertheless, parametric models may be superior to the Cox model and provide more efficient estimates compared to the Cox model under certain conditions. Parametric models have stronger hypotheses compared to semi-parametric models and need to consider the suitability of the probability distribution selected for the survival time. Therefore, it is often preferred to use semi-parametric Cox models in order to avoid the study of the model and the probability of choosing an inappropriate model. To use the Cox model, the proportional hazards (PH) assumption must exist for all independent variables in the final model; i.e., the risk ratio should be constant over time. If this assumption is established, the interpretation of the derived model will be simpler than that of parametric models. Otherwise, the stratified Cox model will be employed, and the risk ratio will not be calculated for the variables for which the assumption does not hold. On the other hand, taking into account the assumptions and choosing the probability distribution for the survival time will make the statistical deduction more precise, and underestimate the standard deviation compared to cases for which such assumptions do not hold 9.
Another parametric model used to analyze the survival data is the accelerate failure time model. Given that the relationship between the survival time logarithm and the auxiliary variables is explicitly determined by a regression equation in the accelerate failure time model, there can be a clear interpretation of the effect of the variables on the survival time. In this model, the appropriate distribution for the response variable should be considered. Most standard parametric models such as Weibull, exponential, Logistic, and normal log are characterized by accelerate failure time. For example, if a distribution has an accelerate failure time and the median survival rate in one group is twice as large as in the other group, the survival rate of the first group will be twice higher than that of the second group 9. The risk function in the accelerate failure time model is defined as:
The basic assumption in the AFT model for comparing the levels of independent random variables is the consistency of the time ratios for each constant value of survival. For example, the survival function in the exponential model is S(t)=exp(-λt), where t is obtained as follows based on S (t):
In other words, the predictive variable X must be graded by the time variable in terms of constant values of S (t). The acceleration factor γ is obtained by the ratio of times, for example for X = 0 and X = 1, which equal exp (α1). After eliminating the constants from the numerator and the denominator:
To analyze the data in this study, they were introduced into the Stata software (version 14) and refined. The data were then described using descriptive methods including frequency distribution tables and descriptive indices. The Kaplan-Meier non-parametric method was also used to estimate the short-term survival rates of one-day, three-day, five-day and nine-day periods as well as the long-term survival rates of one-month, three-month, six-month and one-year periods. To do the regression, first the effects of independent variables on survival rates were separately analyzed for exponential, Weibull, log-logistic, and log-normal models, where the variables with significance levels lower than 0.2 were selected as the candidates to be introduced into the multiple models. The ultimate survival models were fitted through progressive and retrograde methods.
In this study, the ROC area under curve (AUC) criterion 1011 for survival was applied using SurvivalRoc and TimeRoc packages in the R software (version 3.2.3) in order to identify the most efficient model. Also, the Friedman test was employed to compare the AUC values in the fitted AFT models.
Results
In this study, 563 patients with liver cirrhosis were studied, among whom 342 (60.7%) were male and 221 (39.3%) were female. The mean age of the patients was 43.44 (± 13.098) years. The most frequent causes of liver cirrhosis were cryptogenic (21.8%) followed by viral hepatitis (21.5%) and autoimmune (17.2%). At the end of the study, 92 patients (16.3%) died, of whom 57 were male and 35 were female. The ratios of one-year, three-year and five-year survival time were 0.804, 0.650 and 0.420, respectively. Table 1 presents the frequency distribution of the patients’ demographic characteristics (Table 1). Table 2 reports the ratio of short-term and long-term survival of the patients after transplantation (Table 2).
To identify the factors influencing survival after transplantation in liver cirrhosis patients, Weibull, Log-Logistic, exponential, and Log-Normal accelerate models were used. In order to select the variables to be introduced into the Weibull, exponential, log-logistic and log-normal multiple models, the variables were first analyzed for each model separately, with the results presented in Table 3. For all the four variables of age, MELD before LT, INR logarithms, bilirubin, creatinine, WBC was selected as the candidate for entering the multiple models, considering P-value <0.2. After implementation of the multiple Weibull, exponential, log-logistic and log-normal models, the progressive and retrograde method was used considering 0.05 error, and the final models were fitted, with the results outlined in Table 4.
To evaluate the efficacy of Weibull, exponential, log-logistic and log-normal models, the ROC curve AUC for survival was used. Based on the AUC, the model with a higher level of AUC was more efficient. Figure 1 demonstrates that the log-logistic model was more efficient than the three other models. The Friedman test was used to examine the difference between AUC of the models. The paired differences found by the Wilcoxon test revealed that the log-logistic model was significantly different from the other three models (P-value <0.001), and the efficiency of the Weibull and exponential models did not show a significant difference (P-value = 0.555). In addition, the Weibull and exponential models were more efficient than the log-normal model (P-value <0.001). Each of the AUCs of the AFT models diminished over time, indicating the high accuracy of identification of short-term survival compared to long-term survival.
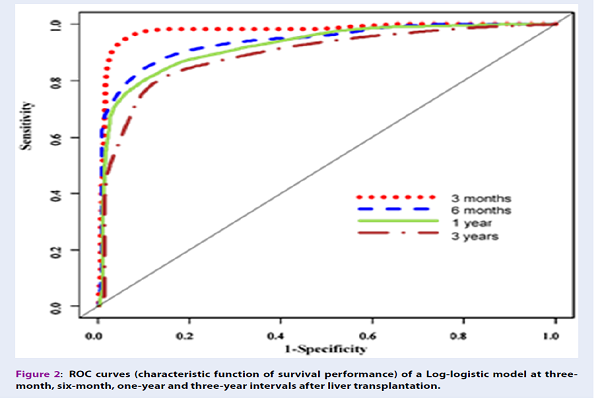
Figure 2 illustrates the ROC curves of the log-logistic model at three-month, six-month, one-year, and six-year intervals, indicating the superiority of detecting short-term survival rates over their long-term counterparts.
| Variables | Alive | Rejected | Dead | Total | Test statistic | P-Value |
| Frequency (%) | Frequency (%) | Frequency (%) | Frequency (%) | |||
| Sex | ||||||
| Male | 190 (62.1%) | 95 (57.6%) | 57 (62.0%) | 342 (60.7%) | X 2 =0.984 | 0.611 |
| Female | 116 (37.9%) | 70 (42.4%) | 35 (38.0%) | 221 (39.3%) | ||
| Educational level | ||||||
| Illiterate | 22 (4.1%) | 21 (3.9%) | 7 (1.3%) | 50 (9.3%) | X 2 =15.788 | 0.046 |
| Lower than diploma | 126 (23.6%) | 66 (12.3%) | 35 (6.5%) | 227 (42.4%) | ||
| Diploma | 88 (16.4%) | 38 (7.1%) | 18(3.4%) | 144 (26.9%) | ||
| Academic | 55 (10.3%) | 31 (5.8%) | 7 (1.3%) | 93 (17.4%) | ||
| Unknown | 8 (1.5%) | 6 (1.1%) | 7 (1.3%) | 21 (3.9%) | ||
| Cause of liver cirrhosis | ||||||
| Cryptogenic | 53 (17.3%) | 27 (16.4%) | 17 (18.5%) | 97 (17.2%) | X 2 =2.620 | 0.855 |
| Autoimmune | 69 (22.5%) | 35 (21.2%) | 19 (20.7%) | 123 (21.8%) | ||
| Viral Hepatitis | 71 (23.2%) | 34 (20.6%) | 16 (17.4%) | 121 (21.5%) | ||
| Other | 113 (36.9%) | 69 (41.8%) | 40 (43.5%) | 222 (39.4%) | ||
| Smoking | ||||||
| No | 230 (76.4%) | 127 (77.9%) | 62 (81.6%) | 419 (77.6%) | X 2 =21.197 | 0.700 |
| In the past | 46 (15.3%) | 26 (16.0%) | 11 (14.5%) | 83 (15.4%) | ||
| Recently | 25 (8.3%) | 10 (16.1%) | 3 (3.9%) | 38 (7.0%) | ||
| Drug abuse | ||||||
| No | 214 (84.6%) | 84 (85.7%) | 49 (87.5%) | 347 (85.3%) | X 2 =1.923 | 0.750 |
| In the past | 36(14.2%) | 14 (14.3%) | 6 (10.7%) | 56 (13.8%) | ||
| Recently | 3 (1.2%) | 0 (0.0%) | 1 (1.8%) | 4 (1.0%) | ||
| Mean (standard deviation) | ||||||
| Age | 45.12 (12.8) | 40.83 (12.7) | 42.5 (13.9) | 43.44 (13.1) | F=6.152 | 0.002 |
| BMI | 70.76 (14.1) | 70.93 (13.6) | 69.56 (15.2) | 70.64 (14.1) | F=0.261 | 0.770 |
| Pre-transplant MELD | 19.96(0.292) | 20.18 (0.94) | 22.79(0.800) | 20.44(0.235) | F=8.852 | <0.001 |
| Bilirubin logarithm | 0.59 (0.047) | 0.711(0.059) | 1.35 (0.168) | 0.70 (0.039) | F=17.756 | <0.001 |
| INR logarithm | 0.34 (0.014) | 0.41 (0.024) | 0.67 (0.063) | 0.40 (0.014) | F=30.547 | <0.001 |
| Creatinine logarithm | 0.12 (0.032) | 0.08 (0.035) | 0.49 (0.098) | 0.14 (0.024) | F=11.541 | <0.001 |
| WBC logarithm | 8.47 (0.034) | 8.48(0.052) | 8.76 (0.113) | 8.50 (0.028) | F=4.584 | 0.011 |
Estimation of the patients’ survival rate after LT on the first, third, fifth, and ninth days and in the first, third, and sixth months as well as after a one-year period is presented in Table 2.
| Survival | Survival rate | Standard deviation | 95% Confidence Interval | |
| Lower bound | Upper bound | |||
| One-day | 0.979 | 0.006 | 0.967 | 0.991 |
| 3- day | 0.977 | 0.006 | 0.965 | 0.989 |
| 5- day | 0.964 | 0.008 | 0.948 | 0.980 |
| 9- day | 0.952 | 0.009 | 0.934 | 0.970 |
| 1-month | 0.938 | 0.010 | 0.918 | 0.958 |
| 3-month | 0.890 | 0.013 | 0.864 | 0.915 |
| 6-month | 0.875 | 0.014 | 0.847 | 0.902 |
| One-year | 0.804 | 0.017 | 0.771 | 0.837 |
| 3-year | 0.653 | 0.023 | 0.608 | 0.698 |
| 5-year | 0.420 | 0.030 | 0.361 | 0.479 |
| Model/ Variable | Exponential | Weibull | Log-logistic | Log-Normal | ||||
| β (S.E) | P | β (S.E) | P | β (S.E) | P | β (S.E) | P | |
| MELD | -0.028(0.011) | 0.018 | -0.030(0.013) | 0.020 | -0.406(0.015) | 0.003 | -0.054(0.017) | 0.002 |
| Age | -0.031(0.011) | 0.009 | -0.032(0.013) | 0.010 | -0.002(0.007) | 0.817 | 0.003(0.007) | 0.669 |
| Sex (Male) | -0.003(0.005) | 0.606 | -0.001(0.006) | 0.815 | -0.163(0.175) | 0.352 | -0.181(0.199) | 0.363 |
| Weight | -0.127(0.130) | 0.324 | -0.127(0.147) | 0.386 | 0.001(0.006) | 0.874 | 0.007(0.007) | 0.309 |
| Height | -0.003(0.005) | 0.545 | -0.003(0.005) | 0.611 | -0.006(0.009) | 0.464 | -0.005(0.010) | 0.634 |
| Ascit | -0.009(0.008) | 0.222 | -0.009(0.003) | 0.024 | -0.208(0.182) | 0.254 | 0.245(0.211) | 0.246 |
| LnWBC | -0.294(0.118) | 0.013 | -0.243(0.088) | 0.006 | -0.309(0.105) | 0.003 | -0.334(0.129) | 0.010 |
| LnINR | -1.339(0.257) | <0.001 | -1.125(0.218) | <0.001 | -1.335(0.259) | <0.001 | -1.5910.312 | <0.001 |
| LnCreatinin | -0.357(0.151) | 0.018 | -0.292(0.116) | 0.012 | -0.397(0.138) | 0.004 | -0.476(0.161) | 0.003 |
| LnBilirubin | -0.052(0.018) | 0.005 | -.039(0.014) | 0.007 | -0.0810.023 | <0.001 | -0.1060.023 | <0.001 |
| Model/ Variable | Exponential | Weibull | Log-logistic | Log-Normal | ||||
| β (S.E) | P | β (S.E) | P | β (S.E) | P | Β (S.E) | P | |
| LnWBC | -0.489(0.149) | 0.010 | -0.507(0.164) | 0.002 | -0.461(0.179) | 0.010 | -0.451(0.195) | 0.021 |
| LnINR | -1.133(0.293) | <0.001 | -1.207(0.325) | <0.001 | -1.244(0.364) | 0.001 | -1.3350.416 | 0.001 |
| LnCreatinin | -.540(0.173) | 0.002 | -0.568(0.191) | 0.003 | -0.576(0.216) | 0.008 | -0.630(0.238) | 0.008 |
| Bilirubin | -0.148(0.106) | 0.163 | -0.170(0.119) | 0.152 | -0.3050.145 | 0.036 | -0.4120.025 | 0.008 |
| Constant | 10.709(1.274) | <0.001 | 11.006(1.420) | <0.001 | 10.3911.529 | <0.001 | 10.5291.683 | <0.001 |
| - | - | 0.909(0.070) | 0.012 | 0.0280.076 | 0.011 | 1.8640.067 | <0.001 | |
| AIC | 714.64 | 711.02 | 709.92 | 750.07 |


Discussion
Currently, liver transplantation (LT) is a standard treatment method with satisfactory survival in patients with advanced and irreversible liver failure. Due to the limited liver donation for transplantation, the high cost of transplantation, and the duration of post-transplantation recovery, factors affecting the survival of cirrhosis patients after transplantation should be taken into consideration 1213.
In a study conducted to analyze the survival of liver cirrhosis patients waiting for transplantation to provide a prioritization system, Abolghasemi et al. indicated that age, bilirubin, and albumin of the patients’ blood had a significant relationship with their survival. They also found that this model was more efficient compared with the MELD score using the AUC criterion 14. In the present study, the MELD score of the patients before liver transplantation in single regression of all AFT models was significant, but none of the AFT models was introduced in the final multiple regression models. In other words, although survival was individually affected by the MELD score, it was not generally significant despite the existence of the variables such as bilirubin, INR, creatinine, and WBC logarithms. The MELD score was obtained using the following formula which includes bilirubin, INR, and creatinine logarithms before transplantation.
MELD = 9.6 × ln (creatinine mg/dL) + 11.2 × ln (INR) + 3.8 × ln (bilirubin mg/dL) + 6.43
In a study by Sabet et al. 15 in 2009, to evaluate the survival after liver transplantation using the six-year results of the transplantation, the MELD score did not affect the survival after liver transplantation in patients with liver cirrhosis. Sabet et al. stated that the reason for the ineffectiveness of the score on survival was the similarity between the MELD scores before transplantation. However, in this study, there was a significant difference between the MELD scores of the dead and rejecting patients and those of the surviving subjects, where the MELD scores of the dead patients after transplantation were higher than those of their surviving counterparts. The reason for the difference in these two studies could be the increased liver donation in the past decade.
Therneau et al. 16 examined the survival of patients undergoing transplantation using the semi-parametric Cox model in the presence of fragility. They found that bilirubin had an effect on the patients’ survival whose rise led to an increase in the survival of the patients. In this study, the patients’ survival had a relationship with their bilirubin logarithm across all AFT models.
The results of a study by Mazzaferro et al. 17 to assess the survival of cirrhosis patients after liver transplantation suggested that the patients’ gender and age during surgery were among the effective factors in the survival of these patients. In the present study, in single regression the exponential and Weibull models, which were combined PH and AFT, revealed that age was an effective factor on survival. However, log-normal and log-logistic models did not show this relationship in the single regression model.
In a study by Kusne et al. 18 to investigate the effect of post-transplantation infections on the survival of patients with liver cirrhosis, it was observed that although the patients underwent transplantation with advanced surgical techniques, post-transplantation infections caused mortality and decreased survival. Since the logarithm of the number of white blood cells after transplantation was associated with infections, the results of this study were consistent with those of the study by Kusne et al.
Conclusion
Based on the results of the use of accelerate models of survival in this study to analyze the survival of cirrhosis patients after transplantation and having examined the efficacy of the models used, the log-logistic model was the most efficient fitted AFT model. One of the features of the log-logistic model was the increase in the number of events (death or rejection) at the beginning of the study which later declined. It was evident based on the number of deaths and rejections after LT. Considering that logarithmic variables of bilirubin, creatinine, INR, and white blood cells had a significant effect on the survival of patients after liver transplantation, it is recommended to reduce mortality and rejection by controlling these values as much as possible.
Competing Interests
The authors declare no conflict of interest.
Authors' Contributions
All authors contributed to the design of the research. JA,MNT, and HT collected the data. JA, HT, MR conducted analysis and interpretation of data. All authors drafted the first version. All authors reviewed, commented and approved the final draft.
Acknowledgments
This research is part of a student thesis for attaining a master's degree with the project number 9411500001. We appreciate all the staff of Tehran Imam Khomeini Hospital's Transplant Department who contributed to the data collection, as well as the Deputy of Education and Research in Iran University of Medical Sciences who supported the implementation of this project.
References
-
Bataller
R.,
Brenner
D. A..
Liver fibrosis. The Journal of Clinical Investigation.
2005;
115
:
209-18
.
View Article PubMed Google Scholar -
Azimi
K,
Sarafi
M,
Alavian
S,
Alavi
M,
Sh
Mikaili J Golestan.
Prevalence of hepatic cirrhosis in Shariati Hospital. Journal of gastroenterology in Iran.
2002;
:
19-27
.
-
Grattagliano
I.,
Ubaldi
E.,
Bonfrate
L.,
Portincasa
P..
Management of liver cirrhosis between primary care and specialists. World Journal of Gastroenterology.
2011;
17
:
2273-82
.
View Article PubMed Google Scholar -
Jr
Wilfredo T Polido,
Lee
Kang-Hoe,
Tay
Khoon-Hean,
Wong
Sin-Yew,
Singh
Ranjodh,
Leong
See-Odd,
Tan
Kai-Chah.
Adult living donor liver transplantation in Singapore: the Asian centre for liver diseases and transplantation experience. Ann Acad Med Singapore.
2007;
9
:
11
.
PubMed Google Scholar -
Starzl
T. E.,
Marchioro
T. L.,
Vonkaulla
K. N.,
Hermann
G.,
Brittain
R. S.,
Waddell
W. R..
Homotransplantation of the liver in humans. Surgery, Gynecology & Obstetrics.
1963;
117
:
659-76
.
-
Moreno
R.,
Berenguer
M..
Post-liver transplantation medical complications. Annals of Hepatology.
2006;
5
:
77-85
.
-
Zahmatkeshan
M,
Amirian
A,
Najib
Kh,
Nikeghbalian
S.
Investigation of Post-transplant Early Infections and Their Risk Factors. Sadra Medical Sciences Journal.
2017;
3
.
-
Lake
J. R.,
Gorman
K. J.,
Esquivel
C. O.,
Wiesner
R. H.,
Klintmalm
G. B.,
Miller
C. M..
The impact of immunosuppressive regimens on the cost of liver transplantation—results from the U.S. FK506 multicenter trial. Transplantation.
1995;
60
:
1089-95
.
View Article Google Scholar -
Kleinbaum
D.,
Klein
M..
Survival analysis: a self-learning text Springer: New York; 1996.
Google Scholar -
Hanley
J. A.,
McNeil
B. J..
The meaning and use of the area under a receiver operating characteristic (ROC) curve. Radiology.
1982;
143
:
29-36
.
View Article PubMed Google Scholar -
Heagerty
P. J.,
Lumley
T.,
Pepe
M. S..
Time-dependent ROC curves for censored survival data and a diagnostic marker. Biometrics.
2000;
56
:
337-44
.
View Article PubMed Google Scholar -
Adam
R.,
Cailliez
V.,
Majno
P.,
Karam
V.,
McMaster
P.,
Caine
R. Y..
Normalised intrinsic mortality risk in liver transplantation: European Liver Transplant Registry study. Lancet.
2000;
356
:
621-7
.
View Article Google Scholar -
Jain
A.,
Reyes
J.,
Kashyap
R.,
Dodson
S. F.,
Demetris
A. J.,
Ruppert
K..
Long-term survival after liver transplantation in 4,000 consecutive patients at a single center. Annals of Surgery.
2000;
232
:
490-500
.
View Article Google Scholar -
Abolghasemi
J.,
Eshraghian
M. R.,
Toosi
M. Nasiri,
Mahmoodi
M.,
Foroushani
A. Rahimi.
Introducing an optimal liver allocation system for liver cirrhosis patients. Hepatitis Monthly.
2013;
13
:
e10479
.
View Article Google Scholar -
Babak
Sabet,,
Abdolreza
Rajaee-fard,,
Saman
Nikeghbalian,,
Ali
Malek-Hosseini, Seyed.
Six Years Liver Transplants Outcome in Shiraz Transplant Center. Journal of Isfahan Medical School.
2009;
27
:
542-9
.
-
Therneau
T. M.,
Grambsch
P. M.,
Pankratz
V. S..
Penalized survival models and frailty. Journal of Computational and Graphical Statistics.
2003;
12
:
156-75
.
View Article Google Scholar -
Mazzaferro
V.,
Battiston
C.,
Perrone
S.,
Pulvirenti
A.,
Regalia
E.,
Romito
R..
Radiofrequency ablation of small hepatocellular carcinoma in cirrhotic patients awaiting liver transplantation: a prospective study. Annals of Surgery.
2004;
240
:
900-9
.
View Article PubMed Google Scholar -
Kusne
S.,
Dummer
J. S.,
Singh
N.,
Iwatsuki
S.,
Makowka
L.,
Esquivel
C..
Infections after liver transplantation. An analysis of 101 consecutive cases. Medicine.
1988;
67
:
132-43
.
View Article Google Scholar
Comments
Downloads
Article Details
Volume & Issue : Vol 5 No 11 (2018)
Page No.: 2789-2796
Published on: 2018-11-11
Citations
Copyrights & License
This work is licensed under a Creative Commons Attribution 4.0 International License.
Search Panel
Pubmed
Google Scholar
Pubmed
Google Scholar
Pubmed
Google Scholar
Pubmed
Search for this article in:
Google Scholar
Researchgate
- HTML viewed - 4398 times
- Download PDF downloaded - 1205 times
- View Article downloaded - 0 times
