

Copyrights: Rafeezul Mohamed, Mohd Azhar Abdul Razak, Nahrizul Adib Kadri, 2019. License: 
This work is licensed under a Creative Commons Attribution 4.0 International License.
Abstract
Introduction: Dielectrophoresis (DEP) is based on polarization and bioparticle movement in applied electric fields. Each type of cells has its own electrical properties within the DEP spectra and undergoes significant changes in direction of frequency following an increase of an applied nonuniform alternating current (AC) electric field. Therefore, DEP can be an effective technique for characterization and separation of different cells. The goal of the current study was to determine the electrophysiological properties of human monocytes and a human monocytic cell line originated from an acute monocytic leukemia patient (THP-1), using a lab on a chip (LOC) device that utilised microarray dot electrodes.
Methods: Ten microliters of human monocytes isolated from peripheral blood mononuclear cells and highly confluent THP-1 cells were diluted in DEP medium and added to the spacer of the LOC device. Subsequently, the AC signal in the range of 10 kHz to 2 MHz was supplied to the LOC device, and the dynamic behaviours of monocytes and THP-1 cells due to the DEP force were observed. Images were captured and analyzed using MATLAB software.
Results: Microscopic visualization showed that THP-1 cells were physically larger than human monocytes. The dielectric parameters (radius, diameter, and conductivity and permittivity of the cytoplasm and membrane) were greater for THP-1 cells compared to monocytes. The cross-over frequencies for THP-1 cells and monocytes were respectively 66 kHz and 280 kHz.
Conclusion: In conclusion, the DEP spectra reflected the morphological differences between monocytes and THP-1 cells. The dielectric properties for each type of cells can be used as the criteria in the development of DEP-based characterization assays.
Introduction
The efficiency of separation and purification techniques is important in studies of leukocyte sub-populations 1. Existing cell sorting approaches, such as fluorescence activated cell sorting (FACS) 2, magnetic cell sorting 3, and pillar-based microchips 4 have become methods of choice for isolating leukocyte sub-populations. All these sorting approaches are based on the markers expressed on the cell surface 5. However, these methods involve several preparations and require expensive and bulky equipment such as large magnets, flow cytometers, columns, and centrifuges 1. Therefore, a new economical sorting device with the ability to discriminate cells, which is compliant with automated and microfluidic applications, is needed 1.
Dielectrophoresis (DEP) stimulates particle movement following interaction with a non-uniform alternating current (AC) electric field 6. The positive DEP (p-DEP) response occurs when the particles move towards the electrode edge, where a high electric field gradient is present 7. When the particles move away from the electrode edge, the response is known as negative DEP (n-DEP) 7. During DEP, particles respond uniquely to different frequencies as they consist of different electrical potentials 8.
DEP effects develop from a non-uniform electric field generated by an electrode. In early DEP studies, electrodes were fabricated from plates, thin metal wires, and needles 9,10. However, today’s advanced micro fabrication technologies facilitate fabrication of DEP platforms based on microelectrode arrays that are able to generate strong DEP forces even when small voltages are applied 11,12. The best-known electrode structures are planar and three-dimensional 13. In the current study, standard photolithographic processes were used to fabricate a 4 × 4 microarray dot electrode. Yafouz et al. 14 described the fabrication process in detail. Similar electrode geometry was used in a previous study designed to characterize cells in homogenous populations 15. Dot electrode geometry offers several advantages, such as confined and well-defined analysis areas, efficient electric range infiltration, and an axis symmetry that allows electrical territory dissemination 15.
Numerous researchers are working on developing a non-invasive separation device to characterize cells based on dielectric parameters 16. DEP has been widely used in cell lysis research 17 and in characterisation of a variety of yeasts 18 and human cells, such as nerve cells 19, platelets 20, sperm cells 21, cancer cells 22, and leukaemia cells 23. Many studies have been conducted to determine the dielectric properties of human whole blood 24, T and B lymphocytes 25,26, and erythrocytes 27.
With the ultimate quest to develop a Lab on a Chip (LOC) device-based sorter that uses a microarray dot electrode, this study was conducted to firstly characterize the dielectric properties (radius, diameter, and conductivity and permittivity of the cytoplasm and membrane) of human monocytes and a human monocytic cell line originated from an acute monocytic leukemia patient (THP-1). In addition, the cross-over frequency of each cell type was also determined.
Methods
Cells, cell culture medium, and reagents
THP-1 cells were purchased from the American Type Culture Collection (ATCC, Manassas, VA, USA). Roswell Park Memorial Institute (RPMI)-1640, fetal bovine serum (FBS), penicillin and streptomycin, and phosphate-buffered saline (PBS) were obtained from Thermo Fisher Scientific (Waltham, MA, USA). Anti-human CD3 FITC, anti-human CD14 FITC and anti-human CD14 PE were obtained from BD Biosciences (San Jose, CA, USA).
Culturing human monocytes and THP-1 cells
To isolate monocytes, 40 mL of freshly collected human blood from healthy volunteers (Universiti Sains Malaysia human ethical approval: USM/JEPeM/140384) were diluted in two volumes of PBS supplemented with 2 mM ethylenediaminetetraacetic acid (EDTA) (Thermo Fisher Scientific, Waltham, MA, USA). The diluted cell suspension was carefully layered onto 15 mL of Ficoll Histopaque (GE Healthcare Life Sciences, Malborough, USA), and then centrifuged at 300 g for 40 min at room temperature in a swinging bucket rotor (brakes off). Following centrifugation, the top layer was pipetted off without disturbing the mononuclear cell layer at the interface. The interface of cells was carefully transferred using a Pasteur pipette into a fresh 50 mL conical tube followed by centrifugation at 300 g for 5 min at 4ºC. Trace amounts of erythrocytes in the cell suspensions were removed using a human erythrocyte lysing kit (R&D Systems, Minnesota, USA) according the manufacturer’s protocols. The cell suspension was centrifuged at 300 g for 5 min, and then, cells were lysed in 5 mL of erythrocyte lysis buffer for 5 min at room temperature. Following incubation, the cell suspension was washed with PBS and centrifuged for 5 min at 300 g. The supernatant was discarded and the cell pellet, which consisted of peripheral blood mononuclear cells (PBMCs), was resuspended in PBS. A haemocytometer was used to count the cells under a light microscope. Phenotypic expression of CD3 and CD14 were determined by BD FACS CANTO II (BD Bioscience, San Jose, CA, USA).
Subsequently, 10 x 106 PBMCs were seeded in a T25 cell culture flask and left to adhere in a 5% CO2 incubator for 2h in complete RPMI medium. Non-adherent cells were discarded and the remainder were washed twice with 3 mL of sterile PBS to completely remove non-adherent cells. Subsequently, 2 mL of complete RPMI were added to the flask, and adherent cells were carefully scrapped off the sides of the flask using a cell scraper. The removed adherent cells were placed in a new 50 mL tube. The flask was then observed under an inverted microscope to identify any remaining cells. If cells were present, complete RPMI medium was added and the scrapping process was repeated. The tube containing the adherent cells was centrifuged at 300 g for 5 min at room temperature. The supernatant was then pipetted off and 1 mL of complete RPMI medium was added to resuspend the cell pellet containing monocytes. Phenotypic expression of CD3 and CD14 were determined by BD FACS CANTO II (BD Bioscience, San Jose, CA, USA).
THP-1 cells were cultured in complete RPMI 1640 supplemented with 10% FBS and 1% penicillin/streptomycin. After the cells reached 90% confluency, they were transferred into a 15 mL centrifuge tube and centrifuged at 300 g for 5 min. After the supernatant was discarded, 1 mL of complete RPMI medium was added to resuspend the cell pellet. A haemocytometer was used to count the cells under a light microscope. Phenotypic expression of CD14 were determined by BD FACS CANTO II (BD Bioscience, San Jose, CA, USA).
After monocytes and THP-1 cells were counted, the cells were centrifuged at 300 g for 5 min in separate tubes. Next, 2 mL of DEP medium (280 mM D-mannitol solution (Sigma Aldrich, Missouri, USA)) were added to each tube after discarding the supernatant. The mixtures were centrifuged again at 300 g for 5 min. The supernatant was discarded, and 1 mL of DEP medium was added to each tube. Finally, 1 x 10⁶ monocytes and THP-1 cells were used to determine their electrical properties using a LOC device.
DEP theory, DEP device and operation
Yafouz et al. 28 described in detail DEP theory, DEP device and operation procedures. The DEP force (FDEP) applied on a spherical particle of radius r is represented by the equation:
ε0 and εmare respectively defined as the permittivity values of the free space and the relative permittivity of the surrounding medium; ∇E is the electric field gradient; and Re[K( ω)] is an important part of the Clausius-Mossotti factor. The Clausius-Mossotti factor is represented by:
εp* and εm* are defined as complex permittivity of the particle and the medium respectively, whereby the complex permittivity is stated as:
ε is the permittivity, ω is the angular frequency, j is the square root of -1 and σ is the material conductivity. The FDEP turns zero at a specific frequency and this phenomenon is known as the crossover frequency (Re[K( ω)] = 0).
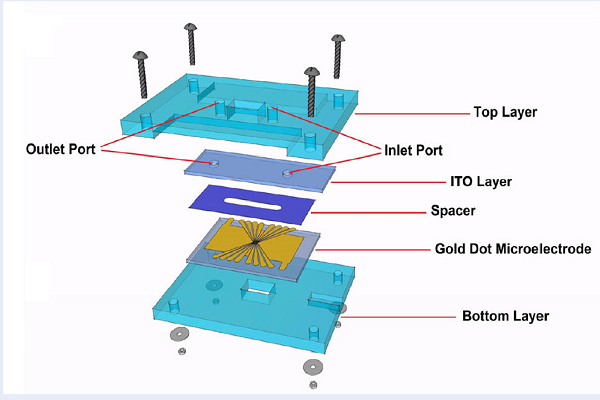
The LOC device was a compact of five layers as shown in Figure 1. A 4 ×4 microarray dot electrode was used (Figure 2), which was fabricated by our team from Universiti Malaya, led by Associate Professor Dr Nahrizul Adib Kadri. This electrode was fabricated using the standard photolithographic processes. Generally, Gold-coated (24K) with microscopic glass slides from Fisher Scientific, New Hampshire, USA were cut into two pieces to acquire the dimension of 38 ×26 mm2. AutoCAD software was used to design microelectrode geometry, and the manufacture of the photomask was performed by JD photo-tools (Oldham, Lancashire, UK). A gold dot microarray electrode was placed on the bottom layer of Indium Tin Oxide (ITO) (15-30 Ω ITO-coated glass slide, SPI Supplies, West Chester, PA, USA), which acted as the ground electrodes counter electrode at the top. The vertical DEP effects generated higher numbers of particles experiencing DEP force.


Experimental set up
5Vp-p sinusoidal electrical signals were supplied to the DEP device by a function generator (Textronix, Beaverton, OR, USA) to provoke the non-uniform electrical range required for DEP. The experiments were carried out by applying one signal to all four dots even though the device was capable of receiving four signals at the same time. For each set of the cells (monocytes and THP-1 cells), 15 individual frequencies in the range of 10 kHz to 2 MHz were transmitted via the microarray dot electrodes. The LOC device was positioned on a microscope stage (BX51, Olympus, Tokyo, Japan), and the plane of the cells was focused to discern the movement of the cells, which was triggered by the DEP force. Images of the cells were captured by a CCD camera (Dino Capture, Torrance, CA, USA), which was placed in one of the microscope eyepieces. The experiment was performed three times for each frequency and each sample. Images were captured after 10 seconds of applying the electrical signal. All images were saved in the dedicated computer for subsequent analysis.
Image analysis
The microscopic images obtained from this experiment were analyzed to evaluate the effects of DEP on monocytes and THP-1 cells to determine their dielectric properties. Initially, the images were segmented into regions of interest (ROIs), in which, the central part of the dot area was segmented into a square shape (Figure 3). All images had the same dimensions of 145 × 145 pixels.

The acquired images were converted into binary images with the threshold value of 170 (Figure 4). The binary images then were converted into black and white using the built-in function im2bw in MATLAB software (Mathworks, Natick, MA, USA). The function had two parameters, known as ‘unsigned integer’ and ‘level’ values. The ‘level’ values were defined as the values between 0 and 1 that measure the intensity of the level boundary. The value was converted to ‘0’ (black) if it was lower than the boundary level, and to ‘1’ (white) if it was above the boundary level. The total number of black pixels for each image was counted using MATLAB software to measure the light intensity.
The alteration of light intensity for each frequency was determined by subtracting the total number of black pixels of an image, without application of the electrical signal applied, from the total number of black pixels of the image with p-DEP and n-DEP effects. The values of light intensity alteration were then normalized and plotted (y-axis) against the applied electrical frequency (x-axis). A single shell dielectric model was used to fit the DEP spectra and identify the radius, membrane specific capacitance, internal conductivity, and permittivity for each cell types.
Statistical analysis
Statistical analysis was conducted using Statistical Package for the Social Sciences (SPSS) version 16.0 (SPSS, Chicago, IL, USA), which assessed the difference in the DEP response between monocyte and THP-1 cells. A t-test was carried out using the individual data points of the intensity shifts at each frequency. A p-value <0.05 was interpreted as statistically significant. The experiment was repeated three times with monocytes isolated from three different donors.
Results
Phenotypic analysis of isolated monocyte and THP-1 cells
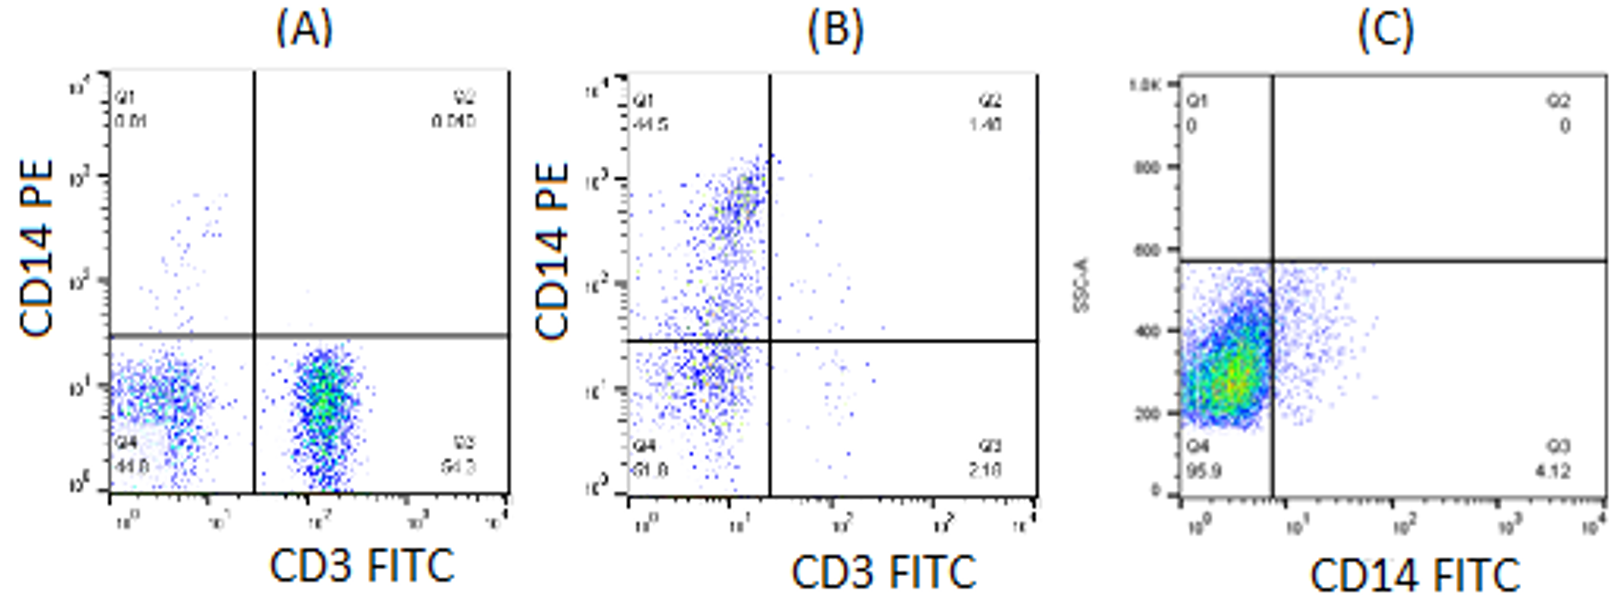
Phenotypic analysis of CD3, which represented T lymphocytes, and CD14, representing monocytes, was carried on isolated PBMC and monocytes. Flow cytometry analysis showed that the percentage of CD3+ and CD14+ in PBMC were respectively 54.3% and 0.81% (Figure 5A). Following two-hour incubation of PBMC in culture flask and serial washing steps, the percentage of CD3+ and CD14+ in adherent monocyte were 2.18% and 44.5%, respectively (Figure 5B). Meanwhile, the percentage of CD14+, which represented monocytes in cultured THP-1 cell, was 4.12% (Figure 5C).
Effect of DEP on monocytes and THP-1 cells
Figure 6 shows representative images of DEP effects on monocytes and THP-1 cells on the dot electrode. Monocytes and THP-1 cells were distributed equally within the dot perimeter before the transmission of AC signals (reference). When the LOC was supplied with 10 kHz and 1.4 MHz, monocytes and THP-1 cells respectively exhibited n-DEP and p-DEP responses. Image analysis showed that THP-1 cells were physically larger and had weaker p-DEP compared to monocytes.

DEP spectra and dielectric properties
The DEP spectra, which represented the effects of DEP on each cell type, were constructed by plotting the light intensity shift (y-axis) against the electrical frequency applied for the captured images (x-axis). The DEP spectra of monocytes and THP-1 cells were analyzed using a wide range of frequencies to determine their electrophysiological properties based on single shell dielectric model. Figure 7 shows the DEP spectra for monocytes. The dielectric parameters for the cytoplasm and membrane of monocytes were as follows: cytoplasmic radius = 3.1 µm, conductivity (σ) = 0.011 S/m, permittivity (ε) = 85; and membrane diameter (d) = 0.5 nm, conductivity (σ) = 0.001 uS/m, permittivity (ε) = 0.64.

Figure 8 shows the DEP spectra for THP-1 cells and their electrophysiological properties based on single shell dielectric model. The dielectric properties for THP-1 in the cytoplasm and membrane, which were greater than those of monocytes, were as follows: cytoplasmic radius = 8 µm, conductivity (σ) = 0.109 S/m, permittivity (ε) = 100; and membrane diameter (d) = 8.2 nm, conductivity (σ) = 0.01 uS/m, permittivity (ε) = 3.7.

The cross-over frequencies for monocytes and THP-1 cells were obtained by adding the best fit lines to the DEP spectrum of each cell type. The cell cross-over frequency was defined as the frequency at which there was no occurance of cell movement in response to DEP. At this point, the light intensity was equal to zero. It was shown that the cross-over frequency was 280 kHz for monocytes and 66 kHz for THP-1 cells (Figure 7,Figure 8). Furthermore, statistical analysis showed that there was a significant difference between DEP spectra of monocytes and THP-1 cells (p<0.05).
| Technique | Cell types | Frequency | Dielectric parameters | References |
| Four electrode inphase quadrature | MDA231,Erythrocytes | 1 kHz–1 GHz | MDA231 (26 ± 4.2 mF/m2)Erythrocytes (9 ± 0.80 mF/m2) | 29 |
| Four electrode inphase quadrature | Leukocytes (WBCs) | 10 kHz–120 MHz | T-lymphocytes (10.5 ± 3.1 mF/m2) | 1 |
| Four electrode inphase quadrature | Leukocytesand A549 | 10 kHz–10 MHz | T lymphocytes (7.01 ± 0.91 mF/m2)SkBr3 (14.83 ± 1.74 mF/m2) | 30 |

Discussion
Dysfunction of innate immune cells can expose the host to various autoimmune diseases such as rheumatoid arthritis (RA) and systemic lupus erythematosis (SLE). Depletion of PBMCs inhibits RA, while granulocytes can induce RA progression 32. Alterations of monocyte morphology and function in SLE patients reduce the ability of these cells to perform phagocytosis of bacteria 33. Thus, the important function of innate immune cells warrant extensive research, and effective techniques for isolating immune cells are critical to the outcome of such studies.
In the current study, a simple and rapid technique for isolating PBMCs and monocytes was used. First, PBMCs were isolated from blood by density gradient centrifugation using Ficoll Histopaque. Following centrifugation, cells and other elements in the blood were separated in the Ficoll Histopaque solution in layers based on their density/size differences 34. Next, monocytes were isolated from PBMCs using adherence technique. This method has several limitations, such as a high percentage of lymphocyte contamination, low flexibility, high manipulation, and monocyte transient activation 35. The first hour of monocyte adherence is characterised by high lymphocyte contamination, but it decreases to 40–50% after two washes and is further reduced to 30% after five washes 35. Bennett et al. 36 reported that after four vigorous washes during the first 24h, monocytes were still contaminated with 24% of lymphocytes 36. Factors such as the number of PBMCs used in the monocyte adherence procedure, the number of washes, vigorous washing, and the duration of adhesion strongly impact the degree of lymphocyte contamination when isolating monocytes using the adherence technique 36. In the current study, the efficiency of CD3 isolation, which represented T lymphocytes, after 2h of culture and vigorous washing, was about 95.9%. On the other hand, the percentage of CD14 expression increased to about 98% in adherent monocytes.
Other techniques for isolating monocytes are available. For example, magnetic activated cell sorting (MACS) technology, which utilises positive selection of classical monocyte-specific markers such as CD14, isolated 90–95% of monocytes (CD14+CD16-) 37. Isolation of monocytes by FACS also achieved 95–98% monocyte purity. However, FACS is suitable for isolating intermediate (CD14++CD16+) or non-classical (CD16++CD14+) monocytes, which express different percentages of CD14 and CD16. Both MACS and FACS also have several disadvantages in addition to the requirement of expensive instruments and accessories. Monocytes isolated by MACS technology can be contaminated by the magnetic particles used to label cells 38. FACS methods reduce the viability of sorted cells due to rapid flow in the machine 38.
THP-1 is a human leukaemia monocytic cell line derived from the peripheral blood of a 1-year old male human with acute monocytic leukemia 39. THP-1 cells are frequently utilised by researchers to determine monocytic functions 40. THP-1 cells express low levels of CD14, which is a surface marker for human monocytes, as observed in our flow cytometry data (Figure 5C) 41. Homogenous genetic background that diminishes donor variability by THP-1 superseded primary monocytes 40. Furthermore, THP-1 cells are easily accessible and can be purchased directly from ATCC. In contrast, primary human monocytes must be isolated from the peripheral blood of a healthy human donor. Several studies have demonstrated that THP-1 displays a more mature monocytic phenotype compared to those of other immortalized human monocyte cell lines, such as U937 cells 42. The interaction between THP-1 and endothelial cells also mimics that of human primary monocytes 43,44,45. A THP-1 cell is a non-adherent cell and thus can be cultured as a cell suspension.
LOC designs offer an alternative sorting technique, and numerous LOC designs have been invented for various applications. Masuda et al. 46 applied DEP in a LOC device to manipulate and discriminate them into different outlets. Fatoyinbo et al. 15 fabricated a device composed of a gold 4 × 4 dot-patterned microarray with a parallel ground indium tin oxide microelectrode on top to rapidly measure the dielectric properties of cells. The advantage of the microarray dot electrode approach is that each dot can be energized separately, and cell electrophysiology can be measured at near real-time speed 13. A similar LOC device with microarray dot electrodes was used in the current study to measure the DEP effect on monocytes and THP-1 cells.
When monocytes and THP-1 cells were subjected to a non-uniform electric field, two different forces were generated between the cells and the surrounding medium, resulting in DEP effects. The movement of the monocytes and THP-1 cells in response to p-DEP or n-DEP forces occurred due to the relative polarizability of the cells and the DEP medium, which consisted of D-Mannitol to dilute the cells. The 280 mM D-mannitol solution is a low conductivity isotonic solution 47. Generally, when the high frequency electrical signal was applied, the cells with p-DEP effect became more polarizable than the surrounding medium. When the low frequency electrical signal was applied, the cells with n-DEP effect became less polarizable than the surrounding medium. The images captured during the experiment showed that THP-1 cells had a weaker p-DEP effect than monocytes due to their morphological differences. Microscopic visualisation showed that THP-1 cells were physically larger than monocytes, and the greater size influenced the strength of p-DEP effects.
The light intensity variation between the original images (before the AC signals were transmitted) and the final images (after the AC signal was applied) was calculated to evaluate cell motions in the ROI. The principle of Beer-Lambert's law of light absorption states that the light intensity corresponds to the cell concentration 28. After AC signals were applied, the light intensity was low for cells with n-DEP effect, as all cells were situated in the middle of the ROI and thus, more black pixels were detected. DEP spectra revealed that the light intensity shifted to the negative side. In contrast, cells with p-DEP effect moved away from the center of the ROI, which increased the light intensity, and fewer black pixels were detected in the image. In this case, the DEP spectra showed that the light intensity shifted to the positive side.
To quantify DEP effects on monocytes and THP-1 cells, DEP spectra of the light intensity shift were plotted against the frequency of the applied AC signals, which ranged from 10 kHz to 2 MHz. The dielectric properties (radius, diameter, and conductivity and permittivity of the cytoplasm and membrane) were determined by adjusting the light intensity shifts towards the shell model that described the cells 48 and conducting the best-fit numerical analysis 49. This method has been used in many DEP characterization studies 50,51,52,53. In the current study, the dielectric properties of the cytoplasm and membrane of THP-1 cells were greater than those of monocytes. To date, this is the first report of the dielectric properties of THP-1 cells, so no data are available for comparison. The dielectric parameters obtained in this study for monocytes were lower than the values reported by Yang et al. 1. They were comparable to those reported for cytoplasm relative permittivity and conductivity, which were in the range of 50–150 and 0.1–1.3 S/m, respectively 54. Values of relative permittivity and conductivity of the cell membrane were reported to be approximately 2–15 and 10–18–10–4 S/m 54. Previous estimation of the thickness of the cell membrane were 4–10 nm 55,56. Table 1 shows a summary of dielectric parameters for other mammalian cells such as mouse lymphocytes and erythrocytes, human erythrocytes, normal and malignant white blood cells and leukemia cells that were measured using a microfluidic electrorotation device and analyzed using a single shell dielectric model 1,29,30.
Monocytes and THP-1 cells are composed of complex internal and membrane structures. Characterization of electrophysiological properties for both cell types was conducted using a single-shell dielectric model (Figure 9), as this model is the most frequently used model for studying cell biology 57,58,59. In this model, a cell is assumed to consist of a conductive interior, such as a sphere or an ellipsoid, surrounded by a weak conducting, concentric, and rigid membrane shell 31,60. AC signal frequencies between 1 kHz and 10 MHz, which are often used in DEP research, mainly produce two cellular dielectric characteristics: plasma membrane capacitance and conductivity 60. Different cells contain distinct dielectric properties, and therefore, are influenced greatly by any changes in the cell physiology or abnormal cell conditions 1,49,61,62. Other factors may also influence the dielectric properties of a cell type, such as intracellular and membrane morphology, membrane surface conductance, ion and molecule dispersion, and transport across the membrane 63. The cell membrane is consisted of lipid, glycolipid, and glycoprotein membrane components, thus, charged molecules may attach to the membrane surface and affect the conductivity and permittivity of the cell membrane 63. The DEP medium also affects the dielectric properties because each cell may act differently in media with different ionic concentrations 1.
The cross-over frequency is defined as the frequency at which the light intensity is equal to zero. At this point, there is no p-DEP or n-DEP effects on the cells. In this study, the sigmoid shape for both monocytes and THP-1 cells was consistent, and the cross-over frequency respectively occurred at 280 kHz and 66 kHz. These results indicate that monocytes and THP-1 cells have unique cross-over frequencies, which in turn suggests that DEP is a reliable approach for characterising the cells. Huang et al. 64 used a silicon-based microchip with interdigitated gold microelectrodes fabricated using standards, a photolithography patterning technique to study characteristics of cells. They found that PBMCs had a wide range of cross-over frequencies, from 35 kHz to 120 kHz, due to the mixed population of cells. They also reported obvious differences in the cross-over frequencies for monocytes (44.6 kHz), natural killer cells (63.2 kHz), B cells (78.8 kHz), and T cells (89.1 kHz).
Conclusions
In conclusion, the different sizes of monocytes and THP-1 cells may explain the observed differences in dielectric properties between these cell types. The dielectric properties of THP-1 cells, which are often used as a model for primary human monocytes, were greater than those of monocytes. These differences indicate that THP-1 cells may not be the best model for studying human primary monocytes. The dielectric properties for each type of cells can be used as the criteria in the development of DEP-based characterization assays.
Abbreviations
AC: Alternating current CD: Cluster of differentiation CCD: Charge couple device DEP: Dielectrophoresis ITO: Indium tin oxide kHz: kilohertz LOC: Lab on Chip MHz: Megahertz n-DEP: Negative-DEP PBMC: Peripheral blood mononuclear cell p-DEP: Positive-DEP
Competing Interests
There is no conflict of interest.
Authors' Contributions
Rafeezul Mohamed carried out the experiment, wrote the manuscript and principal investigator for Universiti Sains Malaysia short term grant. Mohd Azhar Abdul Razak performed the image analysis. Nahrizul Adib Kadri fabricated the LOC device. All the authors read and approved the final manuscript.
References
-
Marszalek
P.,
Zielinsky
J.J.,
Fikus
M.,
Tsong
T.Y.,
Determination of electric parameters of cell membranes by a dielectrophoresis method. Biophys J.
1991;
59
(5)
:
982-7
.
View Article PubMed Google Scholar -
Yang
J.,
Huang
Y.,
Wang
X.,
Wang
X.B.,
Becker
F.F.,
Gascoyne
P.R.,
Dielectric properties of human leukocyte subpopulations determined by electrorotation as a cell separation criterion. Biophys J.
1999;
76
(6)
:
3307-14
.
View Article PubMed Google Scholar -
Lostumbo
A.,
Mehta
D.,
Setty
S.,
Nunez
R.,
Flow cytometry: a new approach for the molecular profiling of breast cancer. Exp Mol Pathol.
2006;
80
(1)
:
46-53
.
View Article PubMed Google Scholar -
Kato
K.,
Radbruch
A.,
Isolation and characterization of CD34+ hematopoietic stem cells from human peripheral blood by high-gradient magnetic cell sorting. Cytometry.
1993;
14
(4)
:
384-92
.
View Article PubMed Google Scholar -
Nagrath
S.,
Sequist
L.V.,
Maheswaran
S.,
Bell
D.W.,
Irimia
D.,
Ulkus
L.,
others
Isolation of rare circulating tumour cells in cancer patients by microchip technology. Nature.
2007;
450
(7173)
:
1235-9
.
View Article PubMed Google Scholar -
Salmanzadeh
A.,
Davalos
R.V.,
Isolation of rare cells through their dielectrophoretic signature. J Membr Sci Technol.
2013;
3
(01)
:
e112
.
View Article Google Scholar -
Ramos
A.,
Morgan
H.,
Green
N.G.,
Castellanos
A.,
Ac electrokinetics: a review of forces in microelectrode structures. J Phys D Appl Phys.
1998;
31
(18)
:
2338-53
.
View Article Google Scholar -
Morgan
H.,
Hughes
M.P.,
Green
N.G.,
Separation of submicron bioparticles by dielectrophoresis. Biophys J.
1999;
77
(1)
:
516-25
.
View Article PubMed Google Scholar -
Abd Rahman
N.,
Ibrahim
F.,
Yafouz
B.,
Dielectrophoresis for biomedical sciences applications: A review. Sensors (Basel).
2017;
17
(3)
:
449
.
View Article PubMed Google Scholar -
Pohl
H.A.,
Pethig
R.,
Dielectric measurements using non-uniform electric field (dielectrophoretic) effects. J Phys E Sci Instrum.
1977;
10
(9)
:
883
.
View Article Google Scholar -
Jones
T.,
Kraybill
J.,
Active feedback-controlled dielectrophoretic levitation. J Appl Phys.
1986;
60
(4)
:
1247-52
.
View Article Google Scholar -
Hamada
R.,
Takayama
H.,
Shonishi
Y.,
Mao
L.,
Nakano
M.,
Suehiro
J.,
A rapid bacteria detection technique utilizing impedance measurement combined with positive and negative dielectrophoresis. Sens Actuators B Chem.
2013;
181
:
439-45
.
View Article Google Scholar -
Martinez-Duarte
R.,
Camacho-Alanis
F.,
Renaud
P.,
Ros
A.,
Dielectrophoresis of lambda-DNA using 3D carbon electrodes. Electrophoresis.
2013;
34
(7)
:
1113-22
.
View Article PubMed Google Scholar -
Yafouz
B.,
Kadri
N.A.,
Ibrahim
F.,
Microarray dot electrodes utilizing dielectrophoresis for cell characterization. Sensors (Basel).
2013;
13
(7)
:
9029-46
.
View Article PubMed Google Scholar -
Yafouz
B.,
Kadri
N.A.,
Ibrahim
F.,
The design and simulation of a planar microarray dot electrode for a dielectrophoretic Lab-on-Chip device. Int J Electrochem Sci.
2012;
7
:
12054-63
.
-
Fatoyinbo
H.O.,
Kadri
N.A.,
Gould
D.H.,
Hoettges
K.F.,
Labeed
F.H.,
Real-time cell electrophysiology using a multi-channel dielectrophoretic-dot microelectrode array. Electrophoresis.
2011;
32
(18)
:
2541-9
.
View Article PubMed Google Scholar -
Huang
Y.,
Wang
X.B.,
Becker
F.F.,
Gascoyne
P.R.,
Introducing dielectrophoresis as a new force field for field-flow fractionation. Biophys J.
1997;
73
(2)
:
1118-29
.
View Article PubMed Google Scholar -
Young
C.W.,
Hsieh
J.L.,
Ay
C.,
Development of an integrated chip for automatic tracking and positioning manipulation for single cell lysis. Sensors (Basel).
2012;
12
(3)
:
2400-13
.
View Article PubMed Google Scholar -
Patel
S.,
Showers
D.,
Vedantam
P.,
Tzeng
T.R.,
Qian
S.,
Xuan
X.,
Microfluidic separation of live and dead yeast cells using reservoir-based dielectrophoresis. Biomicrofluidics.
2012;
6
(3)
:
34102
.
View Article PubMed Google Scholar -
Jaber
F.T.,
Labeed
F.H.,
Hughes
M.P.,
Action potential recording from dielectrophoretically positioned neurons inside micro-wells of a planar microelectrode array. J Neurosci Methods.
2009;
182
(2)
:
225-35
.
View Article PubMed Google Scholar -
Piacentini
N.,
Mernier
G.,
Tornay
R.,
Renaud
P.,
Separation of platelets from other blood cells in continuous-flow by dielectrophoresis field-flow-fractionation. Biomicrofluidics.
2011;
5
(3)
:
34122-341228
.
View Article PubMed Google Scholar -
Rosales-Cruzaley
E.,
Cota-Elizondo
P.A.,
Sánchez
D.,
Lapizco-Encinas
B.H.,
Sperm cells manipulation employing dielectrophoresis. Bioprocess Biosyst Eng.
2013;
36
(10)
:
1353-62
.
View Article PubMed Google Scholar -
Chuang
C.H.,
Huang
Y.W.,
Wu
Y.T.,
System-level biochip for impedance sensing and programmable manipulation of bladder cancer cells. Sensors (Basel).
2011;
11
(11)
:
11021-35
.
View Article PubMed Google Scholar -
Imasato
H.,
Yamakawa
T.,
Eguchi
M.,
Separation of leukemia cells from blood by employing dielectrophoresis. Intelligent Automation and Soft Computing.
2012;
18
(2)
:
139-52
.
View Article Google Scholar -
Schwan
H.P.,
Electrical properties of blood and its constituents: alternating current spectroscopy. Blut.
1983;
46
(4)
:
185-97
.
View Article PubMed Google Scholar -
Bordi
F.,
Cametti
C.,
Rosi
A.,
Calcabrini
A.,
Frequency domain electrical conductivity measurements of the passive electrical properties of human lymphocytes. Biochim Biophys Acta.
1993;
1153
(1)
:
77-88
.
View Article PubMed Google Scholar -
Beving
H.,
Eriksson
L.E.,
Davey
C.L.,
Kell
D.B.,
Dielectric properties of human blood and erythrocytes at radio frequencies (0.2-10 MHz); dependence on cell volume fraction and medium composition. Eur Biophys J.
1994;
23
(3)
:
207-15
.
View Article PubMed Google Scholar -
Ballario
C.,
Bonincontro
A.,
Cametti
C.,
Rosi
A.,
Sportelli
L.,
Effect of extracellular alkali metal salts on the electric parameters of human erythrocytes in normal and pathological conditions (homozygous beta-thalassemia). Z Naturforsch C.
1984;
39
(11-12)
:
1163-9
.
View Article PubMed Google Scholar -
Yafouz
B.,
Kadri
N.A.,
Rothan
H.A.,
Yusof
R.,
Ibrahim
F.,
Discriminating dengue-infected hepatic cells (WRL-68) using dielectrophoresis. Electrophoresis.
2016;
37
(3)
:
511-8
.
View Article PubMed Google Scholar -
Becker
F.F.,
Wang
X.B.,
Huang
Y.,
Pethig
R.,
Vykoukal
J.,
Gascoyne
P.R.,
Separation of human breast cancer cells from blood by differential dielectric affinity. Proc Natl Acad Sci USA.
1995;
92
(3)
:
860-4
.
View Article PubMed Google Scholar -
Han
S.I.,
Joo
Y.D.,
Han
K.H.,
An electrorotation technique for measuring the dielectric properties of cells with simultaneous use of negative quadrupolar dielectrophoresis and electrorotation. Analyst (Lond).
2013;
138
(5)
:
1529-37
.
View Article PubMed Google Scholar -
Wipke
B.T.,
Allen
P.M.,
Essential role of neutrophils in the initiation and progression of a murine model of rheumatoid arthritis. J Immunol.
2001;
167
(3)
:
1601-8
.
View Article PubMed Google Scholar -
Katsiari
C.G.,
Liossis
S.N.,
Sfikakis
P.P.,
The pathophysiologic role of monocytes and macrophages in systemic lupus erythematosus: a reappraisal. Semin Arthritis Rheum.
2010;
39
(6)
:
491-503
.
View Article PubMed Google Scholar -
Fuss
I.J.,
Kanof
M.E.,
Smith
P.D.,
Zola
H.,
Curr Protoc ImmunolJohn Wiley & Sons, Inc: USA; 2009.
Google Scholar -
Bennett
S.,
Breit
S.N.,
Variables in the isolation and culture of human monocytes that are of particular relevance to studies of HIV. J Leukoc Biol.
1994;
56
(3)
:
236-40
.
View Article PubMed Google Scholar -
Bennett
S.,
Por
S.B.,
Stanley
E.R.,
Breit
S.N.,
Monocyte proliferation in a cytokine-free, serum-free system. J Immunol Methods.
1992;
153
(1-2)
:
201-12
.
View Article PubMed Google Scholar -
Delirezh
N.,
Shojaeefar
E.,
Parvin
P.,
Asadi
B.,
Comparison the effects of two monocyte isolation methods, plastic adherence and magnetic activated cell sorting methods, on phagocytic activity of generated dendritic cells. Cell J.
2013;
15
(3)
:
218-23
.
PubMed Google Scholar -
Hu
P.,
Zhang
W.,
Xin
H.,
Deng
G.,
Single Cell Isolation and Analysis. Front Cell Dev Biol.
2016;
4
:
116
.
View Article PubMed Google Scholar -
Tsuchiya
S.,
Yamabe
M.,
Yamaguchi
Y.,
Kobayashi
Y.,
Konno
T.,
Tada
K.,
Establishment and characterization of a human acute monocytic leukemia cell line (THP-1). Int J Cancer.
1980;
26
(2)
:
171-6
.
View Article PubMed Google Scholar -
Schildberger
A.,
Rossmanith
E.,
Eichhorn
T.,
Strassl
K.,
Weber
V.,
Monocytes, peripheral blood mononuclear cells, and THP-1 cells exhibit different cytokine expression patterns following stimulation with lipopolysaccharide. Mediators Inflamm.
2013;
:
697972
.
View Article PubMed Google Scholar -
Bosshart
H.,
Heinzelmann
M.,
Lipopolysaccharide-mediated cell activation without rapid mobilization of cytosolic free calcium. Mol Immunol.
2004;
41
(10)
:
1023-8
.
View Article PubMed Google Scholar -
Altieri
D.C.,
Edgington
T.S.,
The saturable high affinity association of factor X to ADP-stimulated monocytes defines a novel function of the Mac-1 receptor. J Biol Chem.
1988;
263
(15)
:
7007-15
.
PubMed Google Scholar -
Kaplanski
G.,
Marin
V.,
Fabrigoule
M.,
Boulay
V.,
Benoliel
A.M.,
Bongrand
P.,
others
Thrombin-activated human endothelial cells support monocyte adhesion in vitro following expression of intercellular adhesion molecule-1 (ICAM-1; CD54) and vascular cell adhesion molecule-1 (VCAM-1; CD106). Blood.
1998;
92
(4)
:
1259-67
.
PubMed Google Scholar -
Krakauer
T.,
A sensitive ELISA for measuring the adhesion of leukocytic cells to human endothelial cells. J Immunol Methods.
1994;
177
(1-2)
:
207-13
.
View Article PubMed Google Scholar -
Sneddon
A.A.,
McLeod
E.,
Wahle
K.W.,
Arthur
J.R.,
Cytokine-induced monocyte adhesion to endothelial cells involves platelet-activating factor: suppression by conjugated linoleic acid. Biochim Biophys Acta.
2006;
1761
(7)
:
793-801
.
View Article PubMed Google Scholar -
Masuda
S.,
Washizu
M.,
Nanba
T.,
Novel method of cell fusion in field constriction area in fluid integration circuit. IEEE Transactions on Industry.
1989;
25
(4)
:
732-7
.
View Article Google Scholar -
Cheng
I.F.,
Froude
V.E.,
Zhu
Y.,
Chang
H.C.,
Chang
H.C.,
A continuous high-throughput bioparticle sorter based on 3D traveling-wave dielectrophoresis. Lab Chip.
2009;
9
(22)
:
3193-201
.
View Article PubMed Google Scholar -
Broche
L.M.,
Labeed
F.H.,
Hughes
M.P.,
Extraction of dielectric properties of multiple populations from dielectrophoretic collection spectrum data. Phys Med Biol.
2005;
50
(10)
:
2267-74
.
View Article PubMed Google Scholar -
Huang
Y.,
Wang
X.B.,
Becker
F.F.,
Gascoyne
P.R.,
Membrane changes associated with the temperature-sensitive P85gag-mos-dependent transformation of rat kidney cells as determined by dielectrophoresis and electrorotation. Biochim Biophys Acta.
1996;
1282
(1)
:
76-84
.
View Article PubMed Google Scholar -
Mulhall
H.J.,
Labeed
F.H.,
Kazmi
B.,
Costea
D.E.,
Hughes
M.P.,
Lewis
M.P.,
Cancer, pre-cancer and normal oral cells distinguished by dielectrophoresis. Anal Bioanal Chem.
2011;
401
(8)
:
2455-63
.
View Article PubMed Google Scholar -
Duncan
L.,
Shelmerdine
H.,
Hughes
M.P.,
Coley
H.M.,
Hübner
Y.,
Labeed
F.H.,
Dielectrophoretic analysis of changes in cytoplasmic ion levels due to ion channel blocker action reveals underlying differences between drug-sensitive and multidrug-resistant leukaemic cells. Phys Med Biol.
2008;
53
(2)
:
1-7
.
View Article PubMed Google Scholar -
Labeed
F.H.,
Lu
J.,
Mulhall
H.J.,
Marchenko
S.A.,
Hoettges
K.F.,
Estrada
L.C.,
others
Biophysical characteristics reveal neural stem cell differentiation potential. PLoS One.
2011;
6
(9)
:
e25458
.
View Article PubMed Google Scholar -
Bisceglia
E.,
Cubizolles
M.,
Trainito
C.I.,
Berthier
J.,
Pudda
C.,
Francais
O.,
others
A generic and label free method based on dielectrophoresis for the continuous separation of microorganism from whole blood samples. Sens Actuators B Chem.
2015;
212
:
335-43
.
View Article Google Scholar -
Wu
L.,
Lanry Yung
L.Y.,
Lim
K.M.,
Dielectrophoretic capture voltage spectrum for measurement of dielectric properties and separation of cancer cells. Biomicrofluidics.
2012;
6
(1)
:
14113-1411310
.
View Article PubMed Google Scholar -
Hochmuth
R.M.,
Evans
C.A.,
Wiles
H.C.,
McCown
J.T.,
Mechanical measurement of red cell membrane thickness. Science.
1983;
220
(4592)
:
101-2
.
View Article PubMed Google Scholar -
Markx
G.H.,
Davey
C.L.,
The dielectric properties of biological cells at radiofrequencies. Application in biotechnology. Enzyme Microb Technol.
1999;
25
(3-5)
:
161-71
.
View Article Google Scholar -
Irimajiri
A.,
Hanai
T.,
Inouye
A.,
A dielectric theory of model with its application to a lymphoma cell. J Theor Biol.
1979;
78
(2)
:
251-69
.
View Article PubMed Google Scholar -
Jones
T.B.,
Cambridge University Press: Cambridge, New York, USA; 2005.
Google Scholar -
Wang
X.,
Wang
X.B.,
Gascoyne
P.R.,
General expression for dielectrophoretic force and electrorotational torque derived using the Maxwell stress tensor method. J Electrost.
1977;
39
(4)
:
277-95
.
View Article Google Scholar -
Wang
X.,
Becker
F.F.,
Gascoyne
P.R.,
The fractal dimension of cell membrane correlates with its capacitance: a new fractal single-shell model. Chaos.
2010;
20
(4)
:
043133-1
.
View Article PubMed Google Scholar -
Hu
X.,
Arnold
W.M.,
Zimmermann
U.,
Alterations in the electrical properties of T and B lymphocyte membranes induced by mitogenic stimulation. Activation monitored by electro-rotation of single cells. Biochim Biophys Acta.
1990;
1021
(2)
:
191-200
.
View Article PubMed Google Scholar -
Gascoyne
P.R.,
Noshari
B.F.,
Pethig
R.,
Use of dielectrophoretic collection spectra for characterizing differences between normal and cancerous cells. IEEE Trans Ind Appl.
1994;
30
(4)
:
829-34
.
View Article Google Scholar -
Dopp
E.,
Jonas
L.,
Nebe
B.,
Budde
A.,
Knippel
E.,
Dielectric changes in membrane properties and cell interiors of human mesothelial cells in vitro after crocidolite asbestos exposure. Environ Health Perspect.
2000;
108
(2)
:
153-8
.
View Article PubMed Google Scholar -
Huang
C.,
Liu
C.,
Minne
B.,
Hernandez
J.E.,
Stakenborg
T.,
Lagae
L.,
Dielectrophoretic discrimination of cancer cells on a microchip. Appl Phys Lett.
2014;
105
(14)
:
143702
.
View Article Google Scholar
Comments
Downloads
Article Details
Volume & Issue : Vol 6 No 3 (2019)
Page No.: 3040-3052
Published on: 2019-03-31
Citations
Copyrights & License
This work is licensed under a Creative Commons Attribution 4.0 International License.
Search Panel
Pubmed
Google Scholar
Pubmed
Google Scholar
Pubmed
Search for this article in:
Google Scholar
Researchgate
- HTML viewed - 9372 times
- View Article downloaded - 0 times
- Download PDF downloaded - 2696 times
