

Comparison of biomarkers between genotypes 1a and 3a in hepatitis C virus patients with control group
- Food and Mouth Disease Reference Laboratory, Razi Vaccine & Serum Research Institute, Agricultural Research, Education and Extension Organization (AREEO), Karaj, Iran
- Infectious Disease Research Center, Golestan University of Medical Sciences, Gorgan, Iran
- 3Department of Microbiology, School of Medicine, University of Medical Sciences, Gorgan, Iran
- Student Research Committee, Golestan University of Medical Sciences, Gorgan, Iran
- Student Research Committee, Lorestan University of Medical Sciences, Khorramabad, Iran
- Hepatitis Research Center, Lorestan University of Medical Sciences, Khorramabad, Iran
- School of Allied Medical Sciences, Lorestan University of Medical Sciences, Khorramabad, Iran
Abstract
Introduction: Three percent of people worldwide are infected with Hepatitis C virus (HCV). A few studies have been performed to evaluate the biochemical markers of the disease. In the current study, biochemical markers were evaluated in HCV patients and the control group.
Methods: Two sex- and age-matched healthy individuals (n = 100) and HCV positive patients (n = 100) were included (mean age of 20-75, 26.0% females and 74.0% males). Biochemical markers, including liver enzymes (ALT, AST and ALP), lipid profiles (cholesterol, LDL, and HDL) and triglyceride (TG) were investigated in both groups. HCV genotyping was also performed by Polymerase Chain Reaction (PCR) and OHNO methods.
Results: The biochemical markers between HCV patients and controls were compared (cholesterol, ALP, AST, ALT, LDL: p = 0.0001, HDL: p = 0.002, TG: p = 0.003), and statistically significant difference was found between two groups. The biochemical markers between HCV patients and the control group in terms of age was compared and no differences was observed (p = 0.741), however, there was a significant difference in sex between HCV patients and control group (26.0% females, 74.0% males in control group, and x% females and y% males in HCV patients) (p = 0.032). The results of HCV genotyping showed that 39 patients were genotype 1a, and 43 patients were genotype 3a, and 1 patient was genotype 2a. Evaluation of biochemical markers in patients with genotype 1a and 3a showed that there were significant differences in cholesterol (p = 0.001), LDL (p = 0.001) and HDL (p= 0.003) levels, but there were no significant differences in liver enzymes and TG levels in both genotypes.
Conclusion: In the present study, we found significant difference in biochemical markers between HCV patients and controls. In HCV patients, the biochemical markers were dependent on HCV genotypes, and their levels in genotype 1a were higher than genotype 3a. In conclusion, biochemical markers are one of the most important factors for the identification of treatment.
Introduction
Hepatitis C virus (HCV) is the major cause of chronic hepatitis, cirrhosis and hepatocellular carcinoma (HCC) in the world 1. This virus is a single positive-stranded RNA genome of 9.6 Kb and belongs to the Flaviviridae family. Hepacivirus genus contains one long open reading frame (ORF). This single ORF encodes a polyprotein of about 3000 amino acids that produces viral proteins after cleavage by the host and viral encoded proteases2. In addition, core-encoding region of this virus expresses a protein entitled alternative reading frameshift protein (ARFP) or frame-shift protein (F protein) 3,4. It has been shown that in chronic HCV patients, 82% were positive for anti-F antibodies, showing a significant difference from the healthy individuals5. This protein increases the frequency of CD4+CD25+ Treg cells, which may be associated with persistent and chronic infection through subversion of the host immune response6 F proteins could also enhance liver cell proliferation7, which is subsequently associated with the disease progression towards cirrhosis8. The protease function of HCV NS3 protein is also a crucial factor for the induction of liver fibrosis via interaction with cellular miRNAs and down-regulation of miRNA gene expressions9,10.
HCV is transmitted through several ways such as drug injection, blood transfusion and sexual exposure11. It is estimated that more than 170 million people worldwide are infected with hepatitis C virus12. In Iran, approximately 200,000 people are infected with this virus (less than 1%). Also, the prevalence of HCV infection is low among Iranian blood donors13,14. There are six genotypes and more than 70 subtypes of Hepatitis C virus in the world15,16. Epidemiological studies have shown the relationship between HCV genotypes and geographic regions. Predominate genotype in Europe and North America is 1b, in Asia and Mediterranean region is 2 and in Europe is 3, whereas genotype 4 is often found in the Middle East, genotype 5 is only in South Africa, and genotype 6 is dominant in Southeast Asia17,18. Studies have shown that predominate genotypes in Iran are 1a and 3a19.
Hepatitis C virus attachment to hepatocytes is mediated by LDLr, which describes the role of lipids in HCV pathogenesis12,20. Many studies have shown that there is a relationship between serum cholesterol and LDL levels with the development of liver damage and HCV associated-cirrhosis16,20,21. Also, other findings have shown that the association between hepatitis C virus and LDL can protect the virus against antibodies22,23. This approach leads to the design of new drugs for HCV patients. Ledipasvir and Sofosbuvir are used for chronic HCV treatment24,25,26,21.
Fewer studies have been performed to evaluate and compare biochemical markers in HCV patients and healthy individuals (or control group). In the current study, biochemical markers in HCV patients and control group were evaluated and compared. We measured 3 groups of biomarkers: lipid profiles (total cholesterol, low-density lipoprotein (LDL) and high-density lipoprotein (HDL)), liver enzymes (alanine aminotransferase (ALT), aspartate aminotransferase (AST) and alkaline phosphate (ALP)), and triglyceride (TG). Our research objectives included the evaluation of biomarkers in HCV patients and control group, finding the relationship between biomarkers in HCV patients and control group, evaluation of biomarkers in HCV patients with genotypes 1a and 3a, and finding relationship between biomarkers in HCV patients with genotypes 1a and 3a.
Materials and Methods
In this study, information such as age, sex, marital status, HCV genotype, biochemical markers (ALP, AST, ALT, HDL, LDL, TG, and cholesterol), and transmission ways were collected. The information was recorded in a questionnaire.
Study area and subjects
200 volunteers of 100 healthy individuals (control group) and 100 HCV patients were included. The serum samples were collected in a period of 18 months from 2011 to 2013 from HCV patients referred to a special clinic of Digestive Disease Research Center of Ghaem hospital, Mashhad, Iran. Before sampling, all patients were informed and signed the consent form that was approved by Ethics Committee of Mashhad University of Medical Sciences. The serum samples were kept at -70C freezer until examination.
Isolation of HCV RNA, cDNA synthesis and genotyping
HCV RNA was isolated from each patient’s serum using the total RNA extraction kit following instructions by the manufacturer (Pars Tous biotechnology, Mashhad, Iran). HCV RNA was then detected by nested reverse transcription PCR using 5' UTR primers, as previously described by Krekulova 27. Briefly, 10μl extracted RNA were reverse-transcribed into cDNA, using Maloney murine leukemia virus reverse transcriptase (M-MLV RT, 100 units) (Thermo Fisher Scientific) and 1M of downstream primer (outer anti-sense). The products generated from each sample were subjected to two separate PCR amplifications, one with primer set A and the other with primer mix B, in a final 20μl reaction volume containing 4.0μL of 5x First Strand Buffer, 1.0μL, dNTPs (10mM), 3.0μL dH2O and Taq polymerase (Fermentas Life Sciences, USA). The resulting specific HCV bands were visualized by ethidium bromide following electrophoretic separation on 2% agarose gel. Primer set A included primers for genotypes 1a, 1b, 1c, 3a, 3c and 4, while set B included primers for genotypes 2a, 3c, 3b, 5a, and 6a. To determine the sensitivities of PCR assays, prepared plasmids were quantified by UV spectroscopy, and the viral copy number was calculated. The 10-fold serial dilutions of all HCV cDNA-containing plasmids were made. For sensitivity, PCR was performed on a 10-fold dilution of plasmids ranging from 10 to 10 copies/reaction. The specificity was tested by determining the ability of primers to discriminate plasmids with different genotypes of HCV types. There was no specific signal for the independent PCR assays (data not shown). The ability of all types of PCR primers to amplify HCV cDNA-containing plasmids was analysed by using a dilution series that started from 10plasmid copies to 10 plasmid copies. This assay showed significant sensitivity of about 100 viral copies for all HCV genotypes.
The normal and non-normal percent of biomedical markers between HCV patients and control group
Control group | HCV patients | Total | |||||
Variables | Groups | subjects | percent | subjects | percent | subjects | percent |
| Cholesterol | Normal | 62 | 62.00% | 77 | 77.00% | 139 | 69.50% |
| Non-normal | 38 | 38.00% | 23 | 23.00% | 61 | 30.50% | |
| Total | 100 | 100.00% | 100 | 100.00% | 200 | 100.00% | |
| Alanine Aminotransferase (ALT) | Normal | 99 | 99.00% | 28 | 28.00% | 29 | 14.50% |
| Non-normal | 1 | 1.00% | 72 | 72.00% | 171 | 85.50% | |
| Total | 100 | 100.00% | 100 | 100.00% | 200 | 100.00% | |
| Triglyceride (TG) | Normal | 83 | 83.00% | 83 | 83.00% | 166 | 83.00% |
| Non-normal | 17 | 17.00% | 17 | 17.00% | 34 | 17.00% | |
| Total | 100 | 100.00% | 100 | 100.00% | 200 | 100.00% | |
| High-density lipoprotein | Normal | 86 | 86.00% | 57 | 57.00% | 143 | 71.50% |
| (HDL) | Non-normal | 14 | 14.00% | 43 | 43.00% | 57 | 28.50% |
| Total | 100 | 100.00% | 100 | 100.00% | 200 | 100.00% | |
| Low-density lipoprotein | Normal | 76 | 76.00% | 82 | 82.00% | 158 | 79.00% |
| (LDL) | Non-normal | 24 | 24.00% | 18 | 18.00% | 42 | 21.00% |
| Total | 100 | 100.00% | 100 | 100.00% | 200 | 100.00% | |
| Aspartate Aminotransferase (AST) | Normal | 98 | 98.00% | 37 | 37.00% | 135 | 67.50% |
| Non-normal | 2 | 2.00% | 63 | 63.00% | 65 | 32.50% | |
| Total | 100 | 100.00% | 100 | 100.00% | 200 | 100.00% | |
| Alkaline Phosphatase (ALP) | Normal | 99 | 99.00% | 0 | 0.00% | 1 | 0.50% |
| Non-normal | 1 | 1.00% | 100 | 100.00% | 199 | 99.50% | |
| Total | 100 | 100.00% | 100 | 100.00% | 200 | 100.00% |
Minimum, maximum, mean, SD and p-value amounts of biochemical markers between HCV patients and control group
Variable | Groups | Mínimum | Máximum | Mean | SD | P-Value |
Cholesterol | HCV patient | 54 | 456 | 149.6 | 70.2 | Mann-Whitney U=-6.01P-Value=0.0001** |
| control | 118 | 310 | 193.3 | 41.2 | ||
| total | 54 | 456 | 171.6 | 61.4 | ||
ALT | HCV patient | 10 | 3502 | 205.4 | 545.2 | Mann-Whitney U=-8.73P-Value=0.0001** |
| control | 4 | 129 | 19 | 14.9 | ||
| total | 4 | 3502 | 111.8 | 394.9 | ||
TG | HCV patient | 30 | 541 | 125 | 97 | Mann-Whitney U=-2.97P-Value=0.003** |
| control | 45 | 503 | 144.1 | 84.7 | ||
| total | 30 | 541 | 134.6 | 91.3 | ||
HDL | HCV patient | 14 | 125 | 41.1 | 22.8 | Mann-Whitney U=-3.17P-Value=0.002** |
| control | 22 | 98 | 45 | 14.1 | ||
| total | 14 | 125 | 43 | 19 | ||
LDL | HCV patient | 22 | 945 | 101.6 | 110.2 | Mann-Whitney U=-3.88P-Value=0.0001** |
| control | 12 | 231 | 108.6 | 40.2 | ||
| total | 12 | 945 | 105.1 | 82.6 | ||
AST | HCV patient | 11 | 3158 | 209.3 | 454 | Mann-Whitney U=-9.31P-Value=0.0001** |
| control | 7 | 106 | 21.8 | 11.7 | ||
| total | 7 | 3158 | 115.1 | 333.1 | ||
ALP | HCV patient | 55 | 2713 | 401.5 | 475 | Mann-Whitney U=-6.25P-Value=0.0001** |
| control | 34 | 354 | 166.3 | 76.7 | ||
| total | 34 | 2713 | 283.3 | 358.5 |
The normal and non-normal percentage of biomedical markers between genotypes 1a and 3a in HCV patients
Genotype 1a | Genotype 3a | Total | |||||
Variable | Groups | HCV patients | percent | HCV patients | percent | HCV patients | percent |
Cholesterol | Normal | 29 | 74.40% | 38 | 88.40% | 67 | 81.70% |
| Non-normal | 10 | 25.60% | 5 | 11.60% | 15 | 18.30% | |
| Total | 39 | 100.00% | 43 | 100.00% | 82 | 100.00% | |
ALT | Normal | 11 | 28.20% | 11 | 25.60% | 22 | 26.80% |
| Non-normal | 28 | 71.80% | 32 | 74.40% | 60 | 73.20% | |
| Total | 39 | 100.00% | 43 | 100.00% | 82 | 100.00% | |
TG | Normal | 31 | 79.50% | 40 | 93.00% | 71 | 86.60% |
| Non-normal | 8 | 20.50% | 3 | 7.00% | 11 | 13.40% | |
| Total | 39 | 100.00% | 43 | 100.00% | 82 | 100.00% | |
HDL | Normal | 25 | 64.10% | 17 | 39.50% | 42 | 51.20% |
| Non-normal | 14 | 35.90% | 26 | 60.50% | 40 | 48.80% | |
| Total | 39 | 100.00% | 43 | 100.00% | 82 | 100.00% | |
LDL | Normal | 29 | 74.40% | 40 | 93.00% | 69 | 84.10% |
| Non-normal | 10 | 25.60% | 3 | 7.00% | 13 | 15.90% | |
| Total | 39 | 100.00% | 43 | 100.00% | 82 | 100.00% | |
AST | Normal | 12 | 30.80% | 20 | 46.50% | 32 | 39.00% |
| Non-normal | 27 | 69.20% | 23 | 53.50% | 50 | 61.00% | |
| Total | 39 | 100.00% | 43 | 100.00% | 82 | 100.00% | |
ALP | Normal | 0 | 0.00% | 0 | 0.00% | 0 | 0.00% |
| Non-normal | 39 | 100.00% | 43 | 100.00% | 82 | 100.00% | |
| Total | 39 | 100.00% | 43 | 100.00% | 82 | 100.00% |
Minimum, maximum, mean, SD and p-value amounts of biochemical markers between genotypes 1a and 3a in HCV patients
Variable | Groups | Minimum | Maximum | Mean | SD | P-Value |
Cholesterol | 1a | 54 | 362 | 161.9 | 66.6 | Mann-Whitney U=-3.19 |
| 3a | 65 | 456 | 127.9 | 72.7 | P-Value=0.001** | |
| total | 54 | 456 | 144.1 | 71.5 | ||
ALT | 1a | 11 | 3012 | 222.1 | 537 | Mann-Whitney U=-0.757 |
| 3a | 10 | 3502 | 183.5 | 551.2 | P-Value=0.449 | |
| total | 10 | 3502 | 201.9 | 541.5 | ||
TG | 1a | 30 | 448 | 127.8 | 108.2 | Mann-Whitney U=-0.306 |
| 3a | 30 | 298 | 102.4 | 59.8 | P-Value=0.759 | |
| total | 30 | 448 | 114.5 | 86.7 | ||
HDL | 1a | 17 | 120 | 47.7 | 26.5 | Mann-Whitney U=-2.926 |
| 3a | 14 | 125 | 34.2 | 20.1 | P-Value=0.003** | |
| total | 14 | 125 | 40.6 | 24.2 | ||
LDL | 1a | 31 | 945 | 122.3 | 143.3 | Mann-Whitney U=-3.668 |
| 3a | 22 | 625 | 78.9 | 91 | P-Value=0.0001** | |
| total | 22 | 945 | 99.5 | 120 | ||
AST | 1a | 11 | 3158 | 259.1 | 555 | Mann-Whitney U=-1.57 |
| 3a | 12 | 2099 | 141.6 | 337 | P-Value=0.115 | |
| total | 11 | 3158 | 197.4 | 454.9 | ||
ALP | 1a | 98 | 2713 | 441 | 582.5 | Mann-Whitney U=-0.664 |
| 3a | 93 | 1771 | 385.4 | 384.7 | P-Value=0.507 | |
| total | 93 | 2713 | 411.8 | 486.5 |
Comparison of biochemical marker levels between patient and healthy groups
Clinical chemistry kits (Human, Pars Azemoon Kit) and an automatic biochemistry analyzer (Micro Lab 300, Merck Germany) were used to analyze biochemical markers such as aspartate aminotransferase (AST), alanine transaminase (ALT), -glutamyl transferase (-GT), alkaline phosphatase (ALP), high-density lipoprotein (HDL), low-density lipoprotein (LDL), cholesterol and triglycerides (TG) in the serum samples. These biomarkers were evaluated and compared between HCV patients and control group, and between HCV patients with genotypes 1a and 3a.
Statistical analysis
All data were recorded in the previously designed form and analyzed by statistic software SPSS 20. For analysis of biochemical markers between HCV patients and control group, we used Kolmogorov-Smirnov, Asti dent, Man Whitney, Pearson Chi-Square, Fisher's Exact Test and Cochran. At first the Kolmogorov-Smirnov was used, if data were normal, the Student t-test was then used, but if data were not normal, the Man-Whitney test was used. Statistical significance was considered as p < 0.05.
Results
Patients
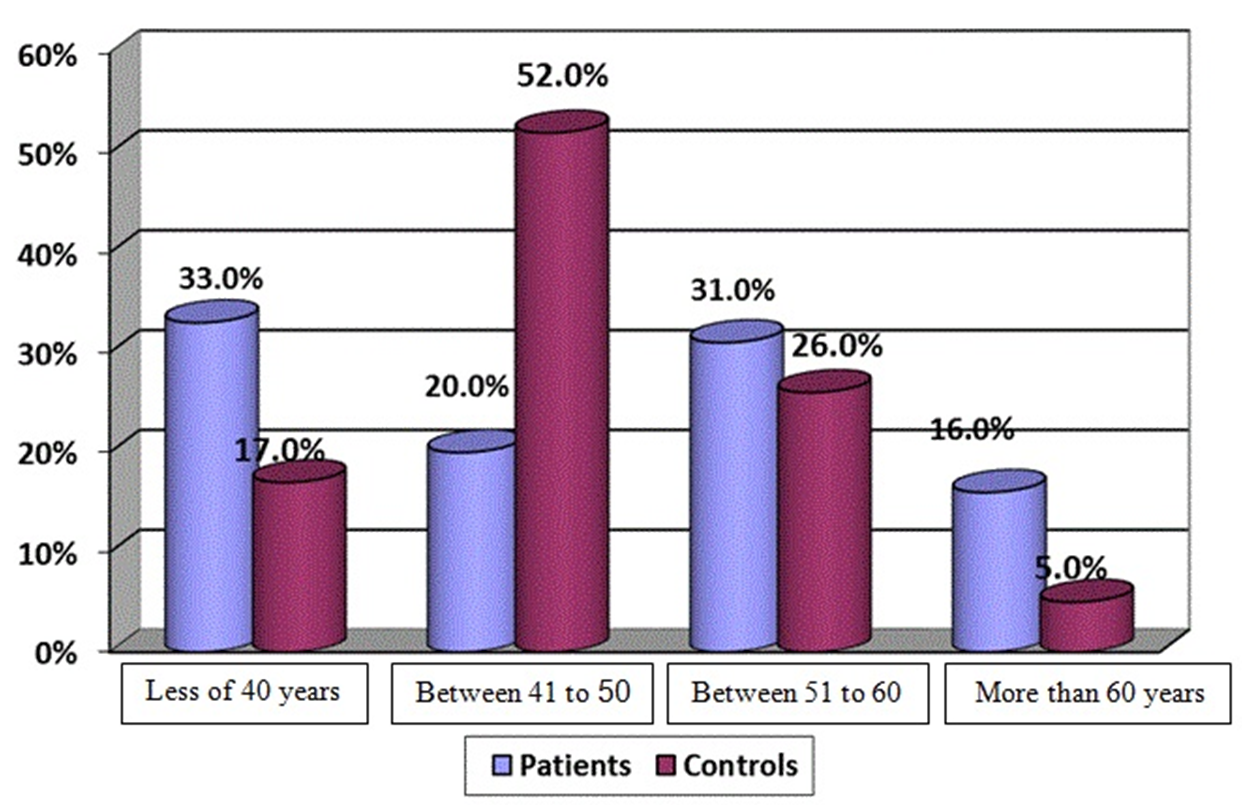
The mean age was 47.3±10.2 for patients and 47.8±9.7 for control group. Information based on age between HCV patients and control group was compared and the difference in age distribution among patient groups was not significant. Figure 1 shows the percentage of HCV patients and control group in four age subgroups. In case of sex (26.0% females, 74.0% males), there was a significant difference between control group (75.0% married, 25.0% single), and HCV patients (81.0% married, 19.0% single) (p = 0.032).
In investigation for other diseases, 4.0% of patients had hemophilia and 1.0% had thalassemia, but there was no hemophilia or thalassemia in control group. Percentage of individuals with diabetes was 4.0% in control group and 5.0% in HCV patients. Percentage of people had other diseases were 6.0% in HCV patients and 3.0% in control group. Transmission ways among HCV patients were different. The most prevalent transmission way of HCV was observed among injective drug users (62%). Other forms of transmission included blood transfusion in patients with hemophilia, thalassemia, and surgery (11.0%), sexual transmission (3.0%), and 20% of the causes were unknown.

Age distributions of HCV patients and control group. The age group analysis of HCV-positive cases revealed that the highest infection rate was among patients less than 40 years of age with 33.0% prevalence. Patient between 51-60 years of age were the most affected (31.0%), while those within the age bracket of more than 60 years were the least affected (16.0%).
HCV typing
In 83% (83/100 in patient group) of clinical specimens positive for HCV, genotype 3a was the most prevalent among the patients (52% or 43/83 patients), followed by genotype 1a and 2a (47% and 1.2%, respectively). No genotypes were obtained for 17% of the patients.
Evaluation of biomarkers in control group and HCV patients
Analysis of associations between HCV genotypes and bio-chemical markers showed that the levels of cholesterol, HDL and LDL significantly differed (p < 0.005) in patient group (cholesterol = 77.0%, LDL = 82.0%, HDL = 57.0%) compared to control group (cholesterol = 62.0%, LDL = 76.0%, HDL = 86.0%). However, no significant differences between two groups in other biomarkers were detected. The normal percentage of TG were identical in two groups (TG = 83.0%) (
The mean levels of lipid profile in HCV patients were: cholesterol = 149.6, LDL = 101.6, HDL = 41.1, and in control group were: cholesterol = 193.3, LDL = 108.6, HDL = 45.0. Mean TG levels in HCV patients was 125.0 and in control group was 144.1. The mean levels of liver enzymes in HCV patients were: ALT = 205.4, AST = 209.3, ALP = 401.5, and in control group were: ALT = 19.0, AST = 21.8, ALP = 166.3 (
Evaluation of biomarkers in HCV patients with genotypes 1a and 3a
The evaluation between genotypes 1a and 3a in HCV patients showed that the normal percentage of lipid profiles in genotype 1a was: cholesterol = 74.4%, LDL = 74.4%, HDL = 64.1%, and in genotype 3a was: cholesterol = 88.4%, LDL = 93.0%, HDL = 39.5%. The normal percentage of liver enzymes in genotype 1a was: ALT = 28.2%, AST = 30.8%, ALP = 0.0%, and in genotype 3a was: ALT = 25.6%, AST = 46.5%, ALP = 0.0%. Also, the normal percentage of TG in genotype 1a was 79.5% and in genotype 3a was 93.0% (
The mean levels of biomedical markers in HCV patients with genotype 1a was: cholesterol = 161.9, LDL = 122.3, ALT = 222.1, TG = 127.8, HDL = 47.7, AST = 259.1, ALP = 441.0, and in HCV patients with genotype 3a was: cholesterol = 127.9, LDL = 78.9, ALT = 183.5, TG = 102.4, HDL = 34.2, AST = 141.6, ALP = 385.4 (
Discussion
In this study, the samples were selected among patients referred to a special clinic of Digestive Disease Research Center of Ghaem hospital in Mashhad, Iran. One hundred HCV positive patients were collected and 82% of them had genotypes 1a and 3a, and 100 healthy individuals were collected as control group. Some factors influence on severity of HCV disease such as: sex, age, other diseases and increased levels of biomarkers. For example the risk of HCV increases with age28,29.
For the evaluation of demography results, we collected male patients three times more than female patients, due to a higher risk of HCV in males in comparison with females. Jamalidoust .30 and Alavian .20 showed similar results.
Sixty two percent of our cases were drug addicted. Jamalidoust and her colleagues had similar samples to the current study and 62.2% of their cases were drug addicted30. Education range was higher in the control group, which can influence on HCV infection, therefore, there is a relationship between education and lower rate of HCV infection. Detection and rapid assessment of chronic liver disease that lead to liver fibrosis is important for monitoring and evaluating the risk of liver cancer. The first step after detection of positive HCV is to measure the levels of liver enzymes. If these markers are higher than normal levels, the individual is infected with chronic liver disease.
Hepatitis C virus enters host cells via LDL and cholesterol receptors, thus, the levels of these biomarkers increase in HCV patients. Agnello31 and Jine32 researched about this topic. Results of our study were opposite to their findings. In the current study, the levels of cholesterol and LDL in HCV patient were lower than that of the control group due of drug consumption and the types of diet, which were given to patients.
The results of our study showed the percentage of normal cholesterol, LDL and HDL levels in patients, which were lower than the levels in control group, and percentage of normal TG was equal in two groups. Orangi et al. evaluated the percentage of normal LDL and HDL in patients and control groups and showed the same results33. However, in a study by Alavian et al., the percentage of normal cholesterol, LDL, HDL and TG levels was lower than those from our patients. One reason for these differences in the results may be due to thalassemia patients in their study. Also, in the current study, the levels of normal ALT, AST and ALP in control group were higher than HCV patients. Alavian et al. showed similar findings to our results in two groups, but Pontisso et al. findings were opposite. Their results showed that percentage of normal ALT was more than 50%34 compared to 28% of normal ALT in our study. This difference may be related to the reason that some of our patients were at the beginning of the treatment, and the medicine had not exerted a full impact. In a study, Peymani et al. used chloroquine drug in non-responder patients for antiviral treatment. They showed that HCV RNA loads and ALT levels were decreased and normalized during treatment35. In the other study, Peymani and his colleagues showed that the use of chloroquine drug could reduce AST, ALT, cholesterol, and triglyceride levels and help to normalize some biochemical markers36. Riaz evaluated the association of HCV genotypes with biomarkers in HCV infected patients. They found that infection with genotype 1a was associated with significantly higher ALT, AST and ALP levels compared to genotype 3a37. Moallemi . determined serum levels of IP-10 (as a new biomarker) in HCV patient and control groups. They found that the levels of IP-10 in patient group was higher than control group, and the difference was statistically significant between two groups. They also checked the levels of this biomarker between HCV genotypes and revealed that the levels of IP-10 were higher in genotype 1a than 3a38. According to the results, we found that the mean levels of biochemical markers in genotype 1a were higher than genotype 3a, also, the percentage of normal biochemical markers were different in genotype 1a and 3a. In evaluation of biochemical markers in the patient group, we found their relationship with genotypes. The new studies have shown a relationship between genotypes and HCV severity. In a research, Jhaveri . showed similar results to our study39. There were differences in the levels of ALT, AST and ALP between two groups. One reason for our different was due to different demography features. In the current study, sampling was randomly performed within 18 months. Some patients had finished their treatments, but some were being treated and the others had not started treatment. We used 7 biomarkers (cholesterol, HDL, LDL, TG, ALT, AST, and ALP), and our patients had special diets and have used drugs. Thus, triglyceride, cholesterol, LDL and HDL levels in these patients were lower than the controls.
The present study assessed the correlation between HCV genotypes with lipid profiles in a small sample size. Thus, it is be important to continue the analysis of lipid profile and characterization of HCV genotypes in a larger population, and to follow their changes over time. Genotyping by PCR is highly specific and sensitive for the determination of HCV genotype, but it is a time-consuming and costly technique. On the other hand, in association with blood born viruses, we need a highly trained technician.
Conclusion
The results of this study showed that there is a significant relationship between biomarkers in both control and patient groups. In HCV patients, the biochemical markers were dependent on HCV genotypes, and their levels in genotype 1a were higher than genotype 3a. There was a significant correlation between cholesterol, HDL, and LDL in patients with genotype 1a and 3a. Biochemical markers may be one of the most important factors that will help in the formulation of treatment strategies. We examined all the demographic information of our patients and control group, however, we did not check the demographic information of other family members. Evaluations of all family members are useful to prevent disease transmission and to help families to improve the patient care.
Competing Interests
Authors declare no conflict of interest