

Copyrights: Paul Chidoka Chikezie, 2020. License: This work is licensed under a Creative Commons Attribution 4.0 International License.
Abstract
Background: Given the vast medicinal properties of Ocimum gratissimum, the present study evaluated, in comparative terms, the acute dysfunctional status of hepatorenal tissues of Wistar rats administered with petroleum ether (PE) and ethyl acetate (EA) leaf extracts of O. gratissimum.
Methods: Grouping of the experimental rats was assigned according to the treatments given, in which graded doses {200, 400, 600 and 800 mg/kg body weight (b.w.)} of PE and EA fractions of O. gratissimum leaf extract were administered to the rats by oral gavage on a daily basis for a period of 21 days. Serum levels of hepatorenal tissues biomarkers were measured using standard spectrophotometric methods. The organ-to-body weight ratio of the rats was measured on the 21st day of the experiment.
Results: Serum aspartate aminotransferase (AST) to alanine aminotransferase (ALT) ratio (i.e. AST/ALT) of the experimental rat groups was found to be within the range of 0.919 – 1.022 unit. The experimental rat groups administered with PE and EA fractions of O. gratissimum leaf extract showed dose-dependent increasing levels of serum alkaline phosphatase (ALP) activity. Likewise, rat groups administered with the herbal extracts exhibited increasing serum total bilirubin, urea and creatinine concentrations, in a dose-dependent manner. At the end of the 21-day treatment period, all the experimental rat groups showed increase in body weight, ranging from 0.79 – 1.98% increase. The liver weight and kidney weight to body weight ratios were within the range of (0.0468 0.02 – 0.0981 0.04) unit and (0.00245 0.002 – 0.01968 0.007) unit, respectively.
Conclusion: The results showed that doses of PE and EA fractions of O. gratissimum leaf extract greater than 400 mg/kg b.w. induced dose-dependent hepatorenal toxicity, with the EA fraction provoking greater toxicity than the PE fraction of O. gratissimum leaf extract.
INTRODUCTION
In general terms, metabolic events within the liver and kidney are essential to ensure constancy in the internal environment of vertebrates2, 1. The control mechanisms of metabolic events in the hepatocytes are regulated at the molecular, organelle, cellular and organ levels4, 3. Endogenous metabolic control mechanisms of hepatocytes involve the actions of regulatory enzymes, organelles responsible for protein and lipid biosynthesis, as well as interactions of the hepatocytes with sinusoidal and Kupffer cells. Meanwhile, exogenous control mechanisms are accomplished by biochemical interactions between the liver and the musculature, as well as interactions among the renal, enteric and endocrine systems.3 The metabolic heterogeneity of hepatocytes in health and disease is summarized elsewhere7, 6, 5. Routine clinical evaluation of the functional status of hepatocytes, the so-called liver function test (LFT)/biliary integrity test (BIT), is established by evaluating activities of non-functional plasma enzyme indicators, namely aspartate transaminase (AST), alanine transaminase (ALT), alkaline phosphatase (ALP), and the inducible hepatocyte smooth endoplasmic reticulum (SER) specific enzyme, γ-glutamyl transferase (γ-GT). As well, albumin, total bilirubin and total protein concentrations in blood samples are examined12, 11, 10, 9, 8.
The nephron is the functional unit of the kidneys. The renal tissues are primarily involved in the removal of low plasma threshold substances, such as urea, creatinine and uric acid. The renal tissues also regulate blood electrolyte concentrations and, by extension, osmolality, extracellular fluid volume and acid-base balance of the vascular system. Furthermore, the kidneys are sites for the biosynthesis of steroid and polypeptide hormones, such as 1, 25 dihydroxyvitamin D, erythropoietin, and renin14, 13. Elevations of plasma low threshold substances in the blood are indicative of compromised renal function. The kidney function test (KFT) measures plasma creatinine and blood urea nitrogen (BUN) levels, among other blood indicators, such that their raised levels in the blood are diagnostic of presentation and progression of renal disease15. The renal/kidney function test indicators are applied in monitoring the efficacy of therapeutic intervention against compromised renal function14.
Ocimum gratissimum L. belongs to the family Lamiaceae16. The plant is a perennial herb widely distributed in warm and temperate regions of the world17. The phytochemical compositions of diethyl ether, ethyl acetate, ethanol and aqueous leaf extracts of O. gratissimum have been exhaustively reported elsewhere23, 22, 21, 20, 19, 18, in which it was noted that O. gratissimum contained relatively high quantities of alkaloids, flavonoids, saponins, methyl cinnamate, camphor, thymol, eugenol, linalool, xanthones, citral, terpenes and lactones24, 23, 22, 21, 20, 18, 17. Traditional medicine practitioners administer O. gratissimum extracts for the treatment and management of fever, rheumatism, paralysis, epilepsy, high fever, diarrhea, sunstroke, influenza, gonorrhea and mental illness26, 25. The use of O. gratissimum extracts by folklore medicine practitioners for the treatment of microbial infections has been validated by empirical investigations23, 22, 20.
There are empirical evidence that edible vegetables and medicinal plants contain deleterious phytochemicals which are usually eliminated by traditional and conventional processing methods prior to consumption of the plant materials28, 27. Some of these edible and medicinal plants have been reported to provoke organ dysfunction and systemic toxicity, especially when ingested in large quantities and unprocessed forms31, 30, 29. However, the susceptibility of animal models to chemical-induced hepatic or systemic toxicity is regulated by genetic, environmental, dietary and pathophysiological factors2. The vast medicinal properties of O. gratissimum notwithstanding, the present study ascertained, in comparative terms, the acute dysfunctional status of hepatorenal tissues using blood levels of enzyme activities and metabolite profiles of hepatorenal origin, as well as organ/body weight indicator in Wistar rats administered with petroleum ether (PE) and ethyl acetate (EA) leaf extracts of O. gratissimum.
METHODS
Collection and identification of leaf samples
Fresh and healthy leaves of O. gratissimum were collected between the period of August 9th and September 2nd, 2019- from a private botanical garden located within Imo State University, Owerri, Nigeria (Latitude 5° 30.2237'N; Longitude 7° 2.6277’E). The leaves were identified and authenticated by a botanist. A voucher number (IMSUH: 021) was assigned to the leaf samples and, thereafter, deposited in the herbarium for reference purposes.
Preparation of leaf samples
The collected leaves of O. gratissimum were washed using tap water and then transferred into an oven (WTC BINDER-7200 Oven, Tuttlingen, Germany). The leaves were dried to constant weight at 50°C for 10-12 h32. The dried leaf samples were pulverized and subsequently stored for use as previously described33.
Extraction and fractionation of leaf extracts
A 500 g part of the pulverized leaf sample of O. gratissimum was subjected to repeated hydro-ethanol (ratio: 2:3 v/v) extraction for 24 h using Soxhlet apparatus. The hydro-ethanolic leaf extract was fractionated according the methods previously described34, but with minor modifications. Fractionation of the hydro-ethanolic leaf extract was carried out by successive partitioning using equal volumes of solvents in the order of increasing polarities, viz. PE > EA. The PE and EA fractions of leaf extract of O. gratissimum were subsequently concentrated under reduced pressure for 12 h at 50 °C in a rotary evaporator (Büch Rotavapor R-200, USA). The separate residues of PE and EA fractions of O. gratissimum leaf extract were dried in a vacuum desiccator. The yield of the fractionated leaf extract of O. gratissimum was calculated as the quotient of dried weight of the fractionated leaf extract to 100 g of the dried pulverized sample subjected to extraction protocol.
The dried PE and EA fractions of O. gratissimum leaf extract were weighed and suspended in measured volumes of phosphate-buffered saline (PBS; pH=7.4), osmotically equivalent to 9.0 g/L NaCl {9.0 g NaCl, 1.71 g Na2HPO4.2H2O and 2.43 g NaH2PO4.2H2O per liter} to give standard solutions. Graded doses {200, 400, 600 and 800 mg/kg body weight (b.w.)} of PE and EA fractions of O. gratissimum leaf extract were formulated and administered to the rats.
Animal handling and experimental design
The male Wistar rats, within the ages of 7 – 9 weeks old and of average weight of 109.74 ± 2.81 g, were obtained from the Animal House of Imo State University, Owerri, Nigeria. Handling of the animals was performed according to the methods previously described33.
The Ethical Committee on the use of animals for research, Department of Biochemistry, Imo State University, Owerri, Nigeria (Ethics Approval Number: ODVC/REN/1232/19) approved the present study. Handling of the rats was in accordance with the standard principles of laboratory animal care of the United States National Institutes of Health (NIH, 1978).
A total of 54 rats were divided into 9 groups of 6 rats each. The rats were deprived of pelletized standard guinea feed (PSGF) (United Africa Company Nigeria Plc., Jos, Nigeria) and water 16 h prior to the commencement of treatment35. The grouping of the experimental rats was assigned according to the treatments given, in which the PE and EA fractions of O. gratissimum leaf extract were administered to the rats by oral gavage on a daily basis for a period of 21 days. All the experimental rat groups received water ad libitum.
Group 1CONTROL: Rats received 1.0 mL/kg b.w. PBS.
The following were rat groups administered with PE fraction of O. gratissimum leaf extract:
Group 2PE200: Rats received 200 mg/kg b.w. PE fraction of O. gratissimum.
Group 3PE400: Rats received 400 mg/kg b.w. PE fraction of O. gratissimum.
Group 4PE600: Rats received 600 mg/kg b.w. PE fraction of O. gratissimum.
Group 5PE800: Rats received 800 mg/kg b.w. PE fraction of O. gratissimum.
The following were rat groups administered with EA fraction of O. gratissimum leaf extract:
Group 6EA200: Rats received 200 mg/kg b.w. EA fraction of O. gratissimum.
Group 7EA400: Rats received 400 mg/kg b.w. EA fraction of O. gratissimum.
Group 8EA600: Rats received 600 mg/kg b.w. EA fraction of O. gratissimum.
Group 9EA800: Rats received 800 mg/kg b.w. EA fraction of O. gratissimum.
Collection and preparation of blood, liver and kidneys
At the end of the experimental time of 21 days, the 12 h post-fasted rats were killed by cervical dislocation. Blood volumes of 0.5 mL were drawn from the orbital sinus of rats and allowed to clot. The serum was measured for hepatorenal tissues biomarkers. The collection and preparation of the liver and kidneys, in order to ascertain their respective weights, were done according to the methods previously described33.
Hepatorenal tissues biomarkers
Serum levels of hepatorenal tissues biomarkers were measured; serum AST and ALT activities were assessed according to the methods of Henry et al.,36 as described37, and by serum ALP activity38, serum total bilirubin concentration39, serum urea concentration40, and serum creatinine concentration41.
Body weight of rats
The body weight of the rats was measured using electronic weighing balance {Digital Precision Weighing Balance (JCS-QC03) – China}, on the 1st and 21st days of the experiment33. Thus:
Where
%∆b.w.: Percentage change in body weight
b.w..AT: Body weight after treatment on day 21
b.w..BT: Body weight before treatment on day 0
Liver and kidney weights to body weight ratios
The liver and right and left kidneys weights were measured on day 21. The organ weight and body weight were reported in grams33. Thus:
Where:
o.w.:b.w.: Organ weight to body weight ratio
o.w.AT: Organ weight after treatment on day 21
b.w.AT: Body weight after treatment on day 21
Data and statistical analyses
The data collected were analyzed by the ANOVA procedure while treatment means were separated by the least significance difference (LSD) incorporated in the statistical analysis system package of Version 9.1 of 2006.
RESULTS
Yield of the fractionated leaf extract of O. gratissimum
The yields of PE and EA fractions of O. gratissimum leaf extract were 8.03 ± 0.07 g per 100 g and 7.56 ± 0.05 g per 100 g of dry leaf sample, respectively.
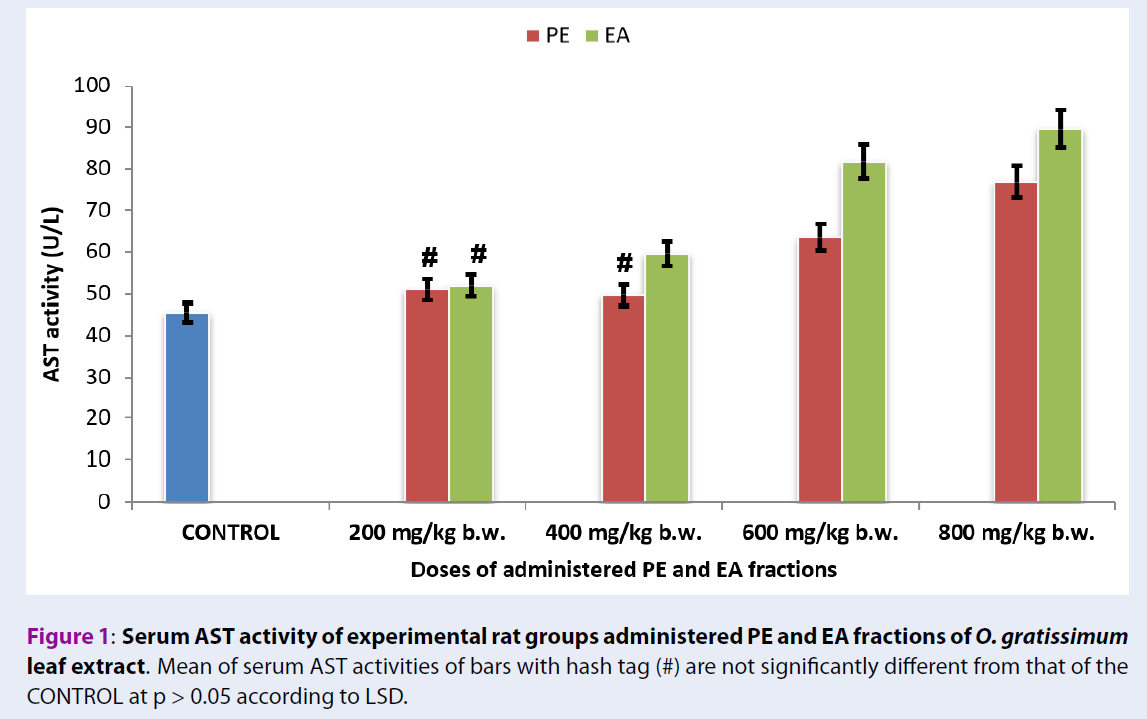
Serum AST activities of rats administered with fractions of O. gratissimum leaf extract
Figure 1 showed that serum AST activities of the experimental rat groups administered with 200 mg/kg b.w. PE and EA fractions of O. gratissimum leaf extract (Group 2PE200 = 50.97 ± 2.12 U/L + Group 6EA200 = 51.97 ± 2.32 U/L) were not significant different (p > 0.05) from that of Group 1CONTROL (45.53 ± 1.92 U/L). Likewise, serum AST activities of the experimental rat groups administered with 400 mg/kg b.w. PE fraction of O. gratissimum leaf extract of Group 3PE400 (49.74 ± 1.99 U/L) versus Group 1CONTROL (45.53 ± 1.92 U/L) showed no significant difference (p > 0.05).
The experimental rat group administered with 400 mg/kg b.w. EA fraction of O. gratissimum leaf extract (Group 7EA400 = 59.62 ± 2.12 U/L) showed serum AST activity that was significantly higher (p < 0.05) than the group administered with PE fraction of O. gratissimum leaf extract (Group 3PE400 = 49.74 ± 2.02 U/L).

Figure 1 showed that the serum AST activities of the experimental rat groups administered with 600 mg/kg b.w. and 800 mg/kg b.w. PE and EA fractions of O. gratissimum leaf extract (Group 4PE600 = 63.51 ± 2.33 U/L + Group 8EA600 = 81.8 ± 3.32 U/L and Group 5PE800 = 76.84 ± 3.05 U/L + Group 9EA800 = 89.57 ± 3.81 U/L) were significantly higher (p < 0.05) than that of Group 1CONTROL (45.53 ± 1.92 U/L). An overview of Figure 1 showed increasing levels of serum AST activities of the herbal-treated groups, which occurred in a dose-dependent manner when compared with Group 1CONTROL.
Serum ALT activities of rats administered with fractions of O. gratissimum leaf extract
Figure 2 showed that serum ALT activity of Group 1CONTROL (49.49 ± 1.52 U/L) was not significantly different (p > 0.05) from those of the experimental rat groups administered with 200 mg/kg b.w. PE and EA fractions of O. gratissimum leaf extract (Group 2PE200 = 52.06 ± 1.82 U/L + Group 6EA200 = 52.09 ± 1.71 U/L), as well as the 400 mg/kg b.w. PE fraction of O. gratissimum leaf extract (Group 3PE400 = 50.04 ± 1.60 U/L).
Specifically, serum ALT activity of the rat groups administered with herbal extract was such that Group 8EA600 = 80.03 ± 3.38 U/L > Group 4PE600 = 64.08 ± 2.32 U/L, and Group 9EA800 = 87.6 ± 3.85 U/L > Group 5PE800 = 76.41 ± 2.02 U/L; p < 0.05. Furthermore, Figure 2 showed dose-dependent increasing levels of serum ALT activities of the rat groups administered with herbal extract.

| Rat Groups | AST/ALT |
|---|---|
| Group 1CONTROL | 0.919 |
| Group 2PE200 | 0.979 |
| Group 3PE400 | 0.994 |
| Group 4PE600 | 0.991 |
| Group 5PE800 | 1.005 |
| Group 6EA200 | 0.997 |
| Group 7EA400 | 1.002 |
| Group 8EA600 | 1.022 |
| Group 9EA800 | 1.022 |
Table 1 showed that the serum AST/ALT ratio of the experimental rat groups was within the range of 0.919 – 1.022 unit. Furthermore, an overview of Table 1 showed that serum AST/ALT ratios of Group 1CONTROL, as well as Group 2PE200 – Group 4PE600, were less than 1.0 unit, whereas those of Group 5PE800 – Group 9EA800 were greater than 1.0 unit.

Serum ALP activities of rats administered with fractions of O. gratissimum leaf extract
Figure 3 showed that serum ALP activities of the experimental rat groups administered with 200 mg/kg b.w. and 400 mg/kg b.w. PE and EA fractions of O. gratissimum leaf extract (Group 2PE200 = 132.56 ± 5.12 U/L + Group 6EA200 133.8 ± 5.09 U/L and Group 3PE400 = 136.78 ± 5.21 U/L + Group 7EA400 = 139.28 ± 5.74 U/L) were not significantly different (p > 0.05) from that of Group 1CONTROL (124.56 ± 4.34 U/L).
Serum ALP activity of Group 4PE600 (153.19 ± 6.74 U/L) was not significantly different (p < 0.05) from that of Group 8EA600 (167.48 ± 6.88 U/L). Likewise, serum ALP activity of Group 5PE800 (158.98 ± 5.28 U/L) and Group 9EA800 (171.68 ± 6.93 U/L) showed no significant difference (p > 0.05). Figure 3 showed dose-dependent increasing levels of serum ALP activities of experimental rat groups administered with PE and EA fractions of O. gratissimum leaf extract.
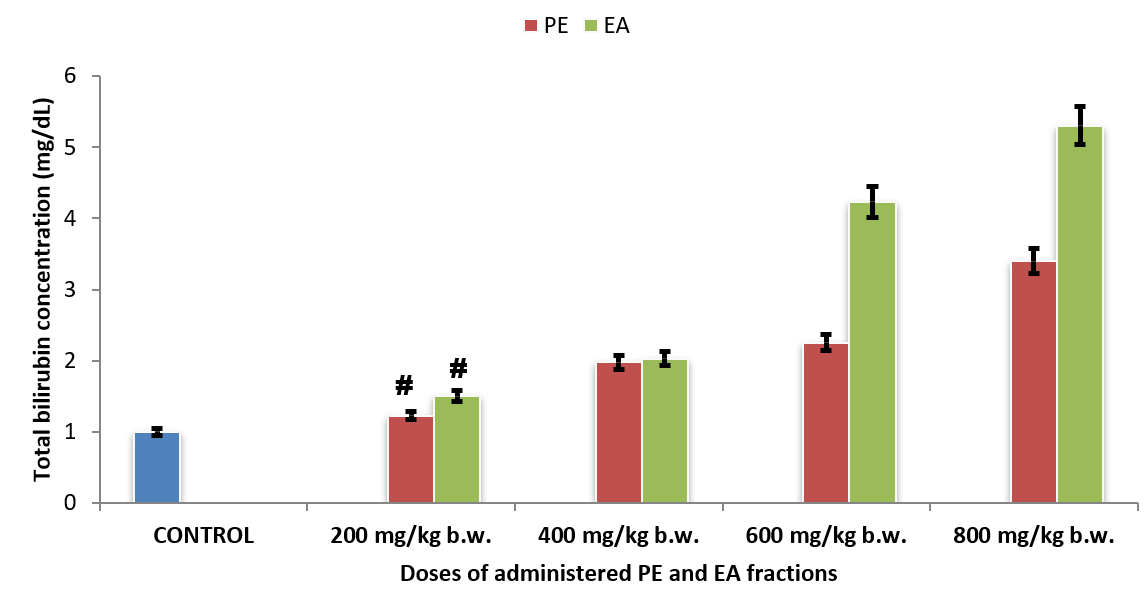
Serum bilirubin concentrations of rats administered with fractions of O. gratissimum leaf extract
Serum total bilirubin concentrations of Group 2PE200 (1.23 ± 0.08 mg/dL) and Group 6EA200 (1.50 ± 0.07 mg/dL) showed no significant difference (p > 0.05) compared with that of Group 1CONTROL (1.00 ± 0.04 mg/dL) (Figure 4). Although serum total bilirubin concentrations of Group 3PE400 (1.98 ± 0.09 mg/dL) and Group 7EA400 (2.03 ± 0.09 mg/dL) showed no significant difference (p > 0.05), their corresponding values were significantly higher (p < 0.05) than that of Group 1CONTROL (1.00 ± 0.04 mg/dL).
Figure 4 showed that increase in the administered doses of PE and EA fractions of O. gratissimum leaf extract caused increasing serum bilirubin concentrations of the experimental rat groups in a dose-dependent manner.

Serum urea concentrations of rats administered with fractions of O. gratissimum leaf extract
Figure 5 showed that serum urea concentrations of the experimental rat groups were such that Group 2PE200 (12.26 ± 2.04 mg/dL), Group 6EA200 (11.33 ± 1.94 mg/dL) and Group 7EA400 (13.83 ± 1.99 mg/dL) were not significantly different (p > 0.05) from that of Group 1CONTROL (12.78 ± 1.15 mg/dL). Additionally, serum urea concentration of Group 3PE400 (16.6 ± 1.75 mg/dL) was significantly higher (p < 0.05) than that of Group 7EA400 (13.83 ± 1.12 mg/dL). The herbal extract- administered rat groups exhibited increasing serum urea concentration in a dose-dependent manner.
In comparative terms, serum urea concentrations of Group 4PE600 (22.67 ± 2.32 mg/dL) and Group 8EA600 (22.00 ± 2.04 mg/dL), as well as Group 5PE800 (29.67 ± 2.48 mg/dL) and Group 9EA800 (29.67 ± 2.38 mg/dL), showed no significant difference (p > 0.05).

Serum creatinine concentrations of rats administered with fractions of O. gratissimum leaf extract
Serum creatinine concentrations of Group 2PE200 (1.07 ± 0.08 mg/dL) and Group 6EA200 (1.27 ± 0.13 mg/dL) showed no significant difference (p > 0.05) from that of Group 1CONTROL (0.97± 0.02 mg/dL) (Figure 6). Additionally, Figure 6 showed that the experimental rat groups administered with PE and EA fractions of O. gratissimum leaf extract, at doses greater than 400 mg/kg b.w., exhibited serum creatinine concentrations that were significantly higher (p < 0.05) than that of Group 1CONTROL (0.97 ± 0.02 mg/dL). Serum creatinine concentration of Group 7EA400 (2.03 ± 0.10 mg/dL) was significantly higher (p < 0.05) than that of corresponding Group 3PE400 (1.40 ± 0.07 mg/dL). On the contrary, serum creatinine concentrations of Group 4PE600 (3.13 ± 0.16 mg/dL) and Group 8EA600 (2.80 ± 0.12 mg/dL), as well as Group 5PE800 (4.50 ± 0.20 mg/dL) and Group 9EA800 (4.50 ± 0.18 mg/dL), showed no significant difference (p > 0.05).
| Groups | Body weight (g) | %∆b.w. | L/b.w.-R | K/b.w.-R | |
|---|---|---|---|---|---|
| b.w.-BT | b.w.-AT | ||||
| Group 1CONTROL | 110.50 ± 1.06 | 112.65 ± 1.01 | 1.95 | 0.0468 ± 0.02 | 0.00245 ± 0.002a |
| Group 2PE200 | 108.83 ± 1.06 | 110.98 ± 1.08 | 1.98 | 0.0542 ± 0.02*a,b | 0.00260 ± 0.002*a,b |
| Group 3PE400 | 109.50 ± 1.00 | 111.33 ± 1.01 | 1.67 | 0.0582 ± 0.02*a,b,c | 0.00379 ± 0.003*a,b,c |
| Group 4PE600 | 110.67 ± 1.09 | 112.37 ± 1.08 | 1.54 | 0.0949 ± 0.05f | 0.00836 ± 0.004f |
| Group 5PE800 | 108.00 ± 1.06 | 109.11 ± 1.03 | 1.03 | 0.0981 ± 0.04f,g | 0.00890 ± 0.005f,g |
| Group 6EA200 | 111.50 ± 1.09 | 112.56 ± 1.08 | 0.95 | 0.0629 ± 0.04c,d | 0.00456 ± 0.004c,d |
| Group 7EA400 | 109.50 ± 1.01 | 110.47 ± 1.05 | 0.89 | 0.0678 ± 0.04c,d,e | 0.00483 ± 0.004c,d,e |
| Group 8EA600 | 109.50 ± 1.09 | 110.37 ± 1.04 | 0.79 | 0.0996 ± 0.05f,g,h | 0.00978 ± 0.005f,g,h |
| Group 9EA800 | 109.67 ± 1.09 | 110.68 ± 1.04 | 0.92 | 0.0972 ± 0.05h,i | 0.01968 ± 0.007h,i |
Body weights and organ-to-body weight ratios of rats administered with fractions of O. gratissimum leaf extract
At the end of the 21-day treatment period, all the experimental rat groups exhibited increase in body weight within the range of 109.11 ± 1.03 to 112.2.65 ± 1.01 g (Table 2). Additionally, Table 2 showed that Group 2PE200 (110.98 ± 1.08 g) exhibited comparatively the highest gain in body weight after treatment, whereas Group 8EA600 (110.37 ± 1.04 g) gave the lowest gain in body weight. Overall, the gain in body weight of the experimental rat groups varied within the range of 0.79 – 1.98%. Specifically, the cumulative gain in body weight of the herbal extract-treated rat groups was such that Group 2PE200 – Group 5PE800 (1.98 – 1.03%) was greater than that of Group 6EA200 – Group 9EA800 (0.95 – 0.79%). The relative gain in body weight of the Group 1CONTROL (112.65 ± 1.01 g) was greater than that of the herbal treated rat groups, except that of Group 2PE200 (110.98 ± 1.08 g).
Table 2 showed that the liver weight to body weight ratios of Group 2PE200 (0.0542 ± 0.02) and Group 3PE400 (0.0582 ± 0.02) were not significantly different (p > 0.05) from that of Group 1CONTROL ( 0.0468 ± 0.02). The cumulative liver weight to body weight ratio of Group 2PE200 – Group 5PE800 was comparatively greater than those of Group 6EA200 – Group 9EA800. Similarly, there was no significant difference (p > 0.05) between the kidney weight to body weight ratio of Group 2PE200 (0.00260 ± 0.002) and Group 3PE400 (0.00379 ± 0.003) (Table 2). However, further increase in the experimental dose of the herbal extract caused increased kidney weight to body weight ratio. The liver weight and kidney weight to body weight ratios of Group 2PE200 were significantly different (p < 0.05) from the corresponding Group 2EA200.
DISCUSSION
The combinations of distinctive molecular species present in PE and EA fractions of O. gratissimum leaf extract obviously dictated the toxic outcomes in the experimental rats. Chemical-induced hepatorenal injuries and resultant dysfunction is often initiated by metabolic transformation of molecular species to reactive intermediate species, such as electrophiles, which alter the function and structure of cellular macromolecules42, 2. Measurement and evaluation of blood indices are fundamental in establishing the pathological and physiological statuses relevant to the clinician, nutritionist and toxicologist43
The liver is primarily rich in aminotransferases, namely AST and ALT, such that their presence in the blood system indicates hepatic necrosis as well as extrahepatic tissue damage or both45, 44, 12, 8. The findings of the present study suggest that doses of PE (≥ 600 mg/kg b.w.) and EA (≥ 400 mg/kg b.w.) fractions of O. gratissimum leaf extract administered to the rats provoked hepatic tissue injuries by virtue of the reported serum AST activities of the experimental rat groups. Likewise, the pattern of serum ALT activities of the experimental rat groups administered with PE and EA fractions of O. gratissimum leaf extract exhibited a mutual relationship with serum AST activities in terms of the dose-depended elevation of serum AST activity. Extrahepatic tissues contain appreciable quantities of the aminotransferases, whereby their raised levels in serum are also diagnostic of extrahepatic tissues necrosis. However, the measure of elevated serum AST and ALT activities are non-specific confirmatory tests for hepatic functional status. Accordingly, for the purpose of differential diagnosis, evaluation of serum AST/ALT ratio is applied in order to ascertain the severity and pathologic status of the animal, as well as to identify and confirm the organ of pathologic interest46, 12. For instance, serum AST/ALT ratio > 1 unit indicates advanced liver fibrosis and chronic hepatitis, whereas serum AST/ALT ratio of 0.9 is diagnostic of nonalcoholic steatohepatitis47, 46, 12. Based on serum aminotransferases indicators, the present study showed that administration of PE and EA fractions of O. gratissimum leaf extract did not substantially cause hepatic dysfunction at relatively low dose of less than 400 mg/kg b.w.; however, the rats exhibited acute hepatic dysfunction following the administration of relatively higher doses of PE and EA fractions of O. gratissimum leaf extract.
Elevation of ALP in the blood is linked to pathology of the liver as well as the mucosal epithelia of small intestine, proximal convoluted tubule of kidney, bone, and placenta. Serum ALP activities of experimental rat groups administered with PE and EA fractions of O. gratissimum leaf extract at doses greater than 600 mg/kg b.w. were substantially higher than the control rat group, which further confirmed a compromised hepatobiliary function and was in agreement with previous reports45, 43, 12, 10, 8. Additionally, previous studies had noted that mild elevation of ALP activity in the blood was indicative of cirrhosis, hepatitis, and congestive cardiac failure48.
Serum total bilirubin concentrations of the experimental rat groups also confirmed that at relatively low dose, PE and EA fractions of O. gratissimum leaf extract did not provoke hepatic dysfunction. Hyperbilirubinemia, which is diagnostic of hepatic dysfunction and hemolytic disorders, is diagnostic when blood serum total bilirubin concentration is greater than 1.0 mg/dL49, 8. Accordingly, serum total bilirubin concentrations of the experimental rat groups administered with 200 mg/dL PE and EA fractions of O. gratissimum leaf extract did not exhibit hepatic dysfunction and hemolytic disorders. Nevertheless, higher doses of PE and EA fractions of O. gratissimum leaf extract elicited hyperbilirubinemia, which was indicative of compromised hepatic dysfunction in the rats. On the contrary, aqueous leaf extract of O. gratissimum was reported to enhance hematological parameters following oral administration to experimental rats24. It therefore implies that the phytocomponents from aqueous leaf extract of O. gratissimum, as compared to PE and EA fractions of O. gratissimum, did not provoke hemolytic disorders and hepatic dysfunction; the blood bilirubin concentration was greater than the upper normal limit of the reference range of blood bilirubin concentration.
The findings of the present study showed that the pattern of renal tissue dysfunction appeared to correspond to that of hepatic tissues following the administration of PE and EA fractions of O. gratissimum leaf extract. Specifically, elevation of serum urea and creatinine concentrations of the experimental rat groups suggest that the severity of compromised renal function was dose-dependent on the administered PE and EA fractions of O. gratissimum leaf extract. In a related research finding, Goniothalamin (GTN), which is a phytocompound from several plants of the genus Goniothalamus, engendered dose-dependent renal dysfunction in Sprague-Dawley rats45. Contrary to the outcome of the present study, Ogundipe et al.16 reported that aqueous leaf extract of O. gratissimum ameliorated gentamicin-induced renal tissues injury in rats. However, based on empirical evidence of low creatinine clearance after 28 days of treatment, they noted that the risk profile of renal dysfunction is not unlikely following the administration of aqueous leaf extract of O. gratissimum16. Another report50 showed that aqueous leaf extract of O. basilicum reversed δ-methrin-induced nephrotoxicity in albino rats. Accordingly, the present research findings appeared to suggest that the molecular species that provoked hepatorenal tissue dysfunction, for the most part, were not associated with the aqueous fraction of O. gratissimum leaf extract. Furthermore, the molecular species from O. gratissimum leaf extract that caused dose-dependent hepatorenal toxicity in the experimental rat groups were hydrophobic in character in view of the fact that they tended to associate with solvents of low polarity, namely, the PE and EA fractions of O. gratissimum leaf extract.
Alteration in visceral organ weight, which precedes morphological changes, is a sensitive indicator of systemic toxicity51, 33. The alteration of visceral organ weight, which is indicative of pathology or compensatory changes in response to stress to the organ, is often reported in relation to the body weight of the experimental animals in toxicological studies53, 52, 51, 43. Notable factors that influence adverse change in visceral organ weight are strain, age and sex of the animal, as well as environmental and experimental conditions54, 51. The results of body weight indicator suggest that molecular species from the EA fraction of O. gratissimum leaf extract caused greater tendency to retard gain in body weight of rats than the corresponding PE fraction. Thus, the EA fraction of O. gratissimum leaf extract appeared to exhibit a greater toxicological score than PE fraction. Furthermore, the pattern of alteration in body weights paralleled the changes in organ-to-body weight ratio of the experimental rat groups. The increase in organ-to-body weight ratio is a reliable indicator of inflammatory response of hepatorenal tissues following the administration of PE and EA fractions of O. gratissimum leaf extract to the experimental rat groups, as previously described51, 33.
Hypertrophy of the hepatic tissues was evident in the experimental rat groups administered with comparatively high doses of PE and EA fractions of O. gratissimum leaf extract. Specifically, the increase in liver-body weight ratio of the experimental rat groups administered with PE and EA fractions of O. gratissimum leaf extract was an indication of hepatocellular hypertrophy, inflammation and fibrosis, with resultant hepatic dysfunction as previously described55, 15. Empirical investigations showed that hepatic hypertrophy is primarily the manifestation of accumulation of lipids as well as other connecting pathologic factors55. The increase in kidney-to-body weight ratio of the experimental rat groups was a reflection of renal toxicity, tubular hypertrophy, and/or chronic progressive nephropathy as previously reported56, 33.
CONCLUSION
For the most part, the administration of PE and EA fractions of O. gratissimum leaf extract at a dose less than 200 mg/kg b.w. did not cause hepatorenal toxicity in the experimental rats. On the contrary, doses of PE and EA fractions of O. gratissimum leaf extract greater than 400 mg/kg b.w. caused dose-dependent hepatorenal toxicity, with the EA fraction provoking greater toxicity than the PE fraction of O. gratissimum leaf extract. Further investigations are required in order to identify, quantify, and characterize the molecular species present in the PE and EA fractions of O. gratissimum leaf extract that elicited the toxic outcomes in the experimental rats.
ABBREVIATIONS
ALP: Alkaline phosphatase
ALT: Alanine transaminase
AST: Aspartate transaminase
EA: Ethylacetate
PE: Petroleum ether
Competing Interests
Authors declare that there are no conflicts of interests.
Authors' Contributions
PCC; conceived and designed the research and supervised the laboratory work. PCC prepared the manuscript. PCC/FOO/VNI/VUE; analyzed the data. PCC/VNI/VUE; collected the plant samples and carried out the laboratory work. All authors have approved the manuscript in the present form and gave the permission to submit the manuscript for publication.
ACKNOWLEDGMENT
The authors are grateful for the technical assistance offered by Mr. C.O. Kabiri, Senior Laboratory Technologist, Department of Biochemistry, Faculty of Science, Imo State University, Owerri.
References
-
Singh
A.,
Bhat
T.K.,
Sharma
O.P.,
Clinical biochemistry of hepatotoxicity.. Journal of Clinical Toxicology.
2011;
2011
(S4)
:
1-19
.
-
Gu
X.,
Manautou
J.E.,
Molecular mechanisms underlying chemical liver injury.. Expert Reviews in Molecular Medicine.
2012;
2012
(14)
:
ẽ
.
View Article Google Scholar -
Kuntz
E.,
Kuntz
H.D.,
Hepatology Textbook and AtlasSpringer: Berlin, Heidelberg; 2008.
Google Scholar -
Mello
T.,
Zanieri
F.,
Ceni
E.,
Oxidative stress in the healthy and wounded hepatocyte: A cellular organelles perspective. Oxidative Medicine and Cellular Longevity.
2016;
2016
:
8327410
.
-
Katz
N.R.,
Metabolic heterogeneity of hepatocytes across the liver acinus. The Journal of Nutrition.
1992;
122
(3)
:
843-9
.
View Article PubMed Google Scholar -
Bhatia
S.N.,
Toner
M.,
Foy
B.D.,
Rotem
A.,
O'Neil
K.M.,
Tompkins
R.G.,
Zonal liver cell heterogeneity: effects of oxygen on metabolic functions of hepatocytes. Cellular Engineering.
1996;
1
:
125-35
.
-
Kudryavtseva
M.,
Bezborodkina
N.N.,
Okovity
S.V.,
Kudryavtsev
B.N.,
Metabolic heterogeneity of glycogen in hepatocytes of patients with liver cirrhosis: the glycogen of the liver lobule zones in cirrhosis. European Journal of Gastroenterology {&}amp; Hepatology.
2001;
13
(6)
:
693-7
.
View Article PubMed Google Scholar -
Thapa
B.R.,
Walia
A.,
Liver function tests and their interpretation. Indian Journal of Pediatrics.
2007;
74
(7)
:
663-71
.
View Article PubMed Google Scholar -
Gowda
S.,
Desai
P.B.,
Hull
V.V.,
Math
A.A.,
Vernekar
S.N.,
S.S. Kulkarni,
A review on laboratory liver function tests. Pan African Medical Journal.
2009;
22
(3)
:
7
.
-
Yap
C.Y.,
Aw
T.C.,
Liver function tests (LFTs). Proceedings of Singapore Healthcare..
2010;
19
(1)
:
80-2
.
View Article Google Scholar -
Coates
P.,
Liver function tests. Australian Family Physician.
2011;
40
(3)
:
113-5
.
PubMed Google Scholar -
Hall
P.,
Cash
J.,
What is the real function of the liver `function' tests?. The Ulster Medical Journal.
2012;
81
(1)
:
30-6
.
PubMed Google Scholar -
Mona
S.H.,
Eman
M.E.,
Aya
A.A.,
Effect of Moringa oleifera on serum lipids and kidney function of hyperlipidemic rats. Journal of Applied Sciences Research.
2013;
9
(8)
:
5189-98
.
-
Gounden
V.,
Jialal
I.,
Renal Function TestsStatPearls Publishing: Treasure Island (FL); 2019.
Google Scholar -
Al-Hindi
B.,
Yusoff
N.A.,
Ahmad
M.,
Atangwho
I.J.,
Asmawi
M.Z.,
Al-Mansoub
M.A.,
Safety assessment of the ethanolic extract of Gongronema latifolium Benth. leaves: A 90-day oral toxicity study in Sprague Dawley rats. BMC Complementary and Alternative Medicine.
2019;
2019
(19)
:
152
.
-
Ogundipe
D.J.,
Akomolafe
R.O.,
Sanusi
A.A.,
Imafidon
C.E.,
Olukiran
O.S.,
Oladele
A.A.,
Ocimum gratissimum ameliorates gentamicin-induced kidney injury but decreases creatinine clearance following sub-chronic administration in rats. Journal of Evidence-Based Complementary {&}amp; Alternative Medicine.
2017;
22
(4)
:
592-602
.
View Article PubMed Google Scholar -
Okon
U.A.,
Owo
D.U.,
Udokang
N.E.,
Udobang
J.A.,
Ekpenyong
C.E.,
Oral Administration of aqueous leaf extract of Ocimum gratissimum ameliorates polyphagia, polydipsia and weight loss in streptozotocin-induced diabetic rats. African Journal of Medicine and Medical Sciences.
2012;
2
(3)
:
45-9
.
-
Ezekwesili
C.N.,
Obiora
K.A.,
Ugwu
O.P.,
Evaluation of antidiarrhoeal property of crude aqueous extract of Ocimum gratissimum L. (Labiatae) in rats. Biokemistri.
2004;
16
:
122-31
.
-
Afolabi
C.A.,
Ibukun
E.O.,
Afor
E.,
Obuotor
E.M.,
Farombi
E.O.,
Phytochemical constituent and antioxidant activity of extract from the leaves of Ocimum gratissimum. Scientific Research and Essays.
2007;
2
(5)
:
163-6
.
-
Nweze
E.I.,
Eze
E.E.,
Justification for the use of Ocimum gratissimum L in herbal medicine and its interaction with disc antibiotics. BMC Complementary and Alternative Medicine.
2009;
9
(37)
:
37
.
View Article PubMed Google Scholar -
Oladosu-Ajayi
R.N.,
Dienye
H.E.,
Ajayi
C.T.,
Erinle
O.D.,
Comparative screening of phytochemical compounds in scent leaf (Ocimum gratissimum) and bitter leaf (Vernonia amygdalina) extracts. Journal of Fisheries and Livestock Production.
2017;
5
(3)
:
1-4
.
-
Adeshina
I.,
Jenyo-Oni
A.,
Emikpe
B.O.,
Ajani
E.K.,
Effect of solvents on phytoconstituents and antimicrobial activities of Ocimum gratissimum and Eugenia caryophyllata extracts on Listeria monocytogenes. Acta Veterinaria Eurasia..
2018;
44
:
31-8
.
-
Sahalie
N.A.,
Abrha
L.H.,
Tolesa
L.D.,
Chemical composition and antimicrobial activity of leave extract of Ocimum lamiifolium (Damakese) as a treatment for urinary tract infection. Cogent Chemistry.
2018;
2018
(4)
:
1440894
.
-
Ofem
O.,
Ani
E.,
Eno
A.,
Effect of aqueous leaves extract of Ocimum gratissimum on hematological parameters in rats. International Journal of Applied {&}amp; Basic Medical Research.
2012;
2
(1)
:
38-42
.
View Article PubMed Google Scholar -
Sofowora
A.,
Medicinal Plants and Traditional Medicine in AfricaSpectrum Books Ltd.: Ibadan, Nigeria; 1993.
Google Scholar -
Chetia
J.,
Upadhyaya
S.,
Saikia
L.R.,
Phytochemical analysis, antioxidant and antimicrobial activity and nutrient content analysis of Ocimum gratissimum Linn from Dibrugarh, N.E. India. International Journal of Pharmaceutical Sciences Review and Research.
2014;
25
(1)
:
229-35
.
-
Chikezie
P.C.,
Ojiako
O.A.,
Cyanide and aflatoxin loads of processed Cassava (Manihot esculenta) tubers (Garri) in Njaba, Imo State, Nigeria. Toxicology International.
2013;
20
(3)
:
261-7
.
View Article PubMed Google Scholar -
Ndidi
U.S.,
Ndidi
C.U.,
Olagunju
A.,
Muhammad
A.,
Billy
F.G.,
Okpe
O.,
Northwest Nigeria. Journal of Food Processing 2014.
Google Scholar -
Chikezie
P.C.,
Ibegbulem
C.O.,
Mbagwu
F.N.,
Bioactive principles from medicinal plants. Research Journal of Phytochemistry.
2015;
9
(3)
:
88-115
.
View Article Google Scholar -
Rašković
A.,
Pavlović
N.,
Kvrgić
M.,
Sudji
J.,
Mitić
G.,
\vCapo
I.,
Effects of pharmaceutical formulations containing thyme on carbon tetrachloride-induced liver injury in rats.. BMC Complementary and Alternative Medicine.
2015;
2015
(15)
:
442
.
-
Ibegbulem
C.O.,
Chikezie
P.C.,
Comparative proximate composition and cyanide content of peeled and unpeeled cassava tubers processed into garri by traditional methods. Research Journal of Food and Nutrition..
2018;
2
(1)
:
1-13
.
-
Ojiako
A.O.,
Chikezie
P.C.,
Ogbuji
C.A.,
Histopathological studies of renal and hepatic tissues of hyperglycemic rats administered traditional herbal formulations. International Journal of Green Pharmacy..
2015;
9
(3)
:
184-91
.
View Article Google Scholar -
Chikezie
C.M.,
Ojiako
A.O.,
Emejulu
A.A.,
Chikezie
P.C.,
Serum lactate dehydrogenase activity and visceral organs and body weights of diabetic rats administered single and combinatorial herbal formulations. Pharmacognosy Communications.
2018;
8
(1)
:
37-42
.
View Article Google Scholar -
Okoye
T.C.,
Akah
P.A.,
Okoli
C.O.,
Ezike
A.C.,
Mbaoji
F.N.,
Antimicrobial and antispasmodic activity of leaf extract and fractions of Stachytarpheta cayennensis. Asian Pacific Journal of Tropical Medicine.
2010;
2010
(3)
:
189-92
.
View Article Google Scholar -
Ibegbulem
C.O.,
Chikezie
P.C.,
Hypoglycemic properties of ethanolic extracts of Gongronema latifolium, Aloe perryi, Viscum album and Allium sativum administered to alloxan-induced diabetic albino rats (Rattus norvegicus). Pharmacognosy Communications.
2013;
3
(2)
:
12-6
.
View Article Google Scholar -
Henry
R.J.,
Chiamori
N.,
Golub
O.J.,
Berkman
S.,
Revised spectrophotometric methods for the determination of glutamic-oxalacetic transaminase, glutamic-pyruvic transaminase, and lactic acid dehydrogenase. American Journal of Clinical Pathology.
1960;
34
:
381-98
.
View Article PubMed Google Scholar -
Onunogbo
C.C.,
Ohaeri
O.C.,
Eleazu
C.O.,
Effect of Mistletoe (Viscum album) extract on the blood glucose, liver enzymes and electrolyte balance in alloxan induced diabetic rats. American Journal of Biochemistry and Molecular Biology..
2013;
3
(1)
:
143-50
.
View Article Google Scholar -
Njoku
V.O.,
Chikezie
P.C.,
Kaoje
A.M.,
Kinetic studies of alkaline phosphatase extracted from rabbit (Lepus townsendii) liver. African Journal of Biotechnology.
2011;
10
(16)
:
3157-62
.
View Article Google Scholar -
Pearlman
F.C.,
Lee
R.T.,
Detection and measurement of total bilirubin in serum, with use of surfactants as solubilizing agents. Clinical Chemistry.
1974;
20
(4)
:
447-53
.
View Article PubMed Google Scholar -
Fawcett
J.K.,
Scott
J.E.,
A rapid and precise method for the determination of urea. Journal of Clinical Pathology.
1960;
13
(2)
:
156-9
.
View Article PubMed Google Scholar -
Bonsnes
R.W.,
Taussky
H.N.,
On the colorimetric determination of creatinine by the Jaffe reaction. The Journal of Biological Chemistry.
1945;
158
:
581-91
.
-
Guan
Y-S.,
He
Q.,
Plants Consumption and Liver Health. Evidence-Based Complementary and Alternative Medicine.
2015;
2015
(824185)
:
1-10
.
-
Nigatu
T.A.,
Afework
M.,
Urga
K.,
Ergete
W.,
Makonnen
E.,
Toxicological investigation of acute and chronic treatment with Gnidia stenophylla Gilg root extract on some blood parameters and histopathology of spleen, liver and kidney in mice. BMC Research Notes.
2017;
10
(625)
:
1-13
.
-
Oh
R.C.,
Hustead
T.R.,
Causes and evaluation of mildly elevated liver transaminase levels. American Family Physician.
2011;
84
(9)
:
1003-8
.
PubMed Google Scholar -
Kaid
F.,
Alabsi
A.M.,
Alafifi
N.,
Ali-Saeed
R.,
Al-koshab
M.A.,
Ramanathan
A.,
Histological, biochemical, and hematological effects of Goniothalamin on selective internal organs of male Sprague-Dawley rats.. Journal of Toxicology.
2019;
2019
(6493286)
:
1-13
.
View Article Google Scholar -
Giannini
E.,
Botta
F.,
Fasoli
A.,
Ceppa
P.,
Risso
D.,
Lantieri
P.B.,
Progressive liver functional impairment is associated with an increase in AST/ALT ratio. Digestive Diseases and Sciences.
1999;
44
(6)
:
1249-53
.
View Article PubMed Google Scholar -
Nyblom
H.,
Nordlinder
H.,
Olsson
R.,
High aspartate to alanine aminotransferase ratio is an indicator of cirrhosis and poor outcome in patients with primary sclerosing cholangitis. Liver International.
2007;
27
(5)
:
694-9
.
View Article PubMed Google Scholar -
Rosalki
S.B.,
Mcintyre
N.,
Biochemical investigations in the management of liver disease. Oxford Textbook of Clinical HepatologyOxford university press: New York; 1999.
Google Scholar -
Murray
R.K.,
Porphyrins and bile pigments. Harper’s Illustrated BiochemistryLange Medical Books/McGraw-Hill: New York; 2003.
Google Scholar -
Sakr
S.A.,
Al-Amoudi
W.M.,
Effect of leave extract of Ocimum basilicum on deltamethrin induced nephrotoxicity and oxidative stress in albino rats. Journal of Applied Pharmaceutical Science.
2012;
2
(5)
:
22-7
.
View Article Google Scholar -
Piao
Y.,
Liu
Y.,
Xie
X.,
Change trends of organ weight background data in sprague dawley rats at different ages. Journal of Toxicologic Pathology.
2013;
26
(1)
:
29-34
.
View Article PubMed Google Scholar -
Michael
B.,
Yano
B.,
Sellers
R.S.,
Perry
R.,
Morton
D.,
Roome
N.,
Evaluation of organ weights for rodent and non-rodent toxicity studies: a review of regulatory guidelines and a survey of current practices. Toxicologic Pathology.
2007;
35
(5)
:
742-50
.
View Article PubMed Google Scholar -
Mubbunu
L.,
Bowa
K.,
Petrenko
V.,
Silitongo
M.,
Correlation of internal organ weights with body weight and body height in normal adult Zambians: A case study of Ndola Teaching Hospital.. Anatomy Research International.
2018;
2018
(4687538)
:
1-5
.
-
Gur
E.,
Waner
T.,
The variability of organ weight background data in rats. Laboratory Animals.
1993;
27
(1)
:
65-72
.
View Article PubMed Google Scholar -
Ipsen
D.H.,
Lykkesfeldt
J.,
Tveden-Nyborg
P.,
Molecular mechanisms of hepatic lipid accumulation in non-alcoholic fatty liver disease. Cellular and Molecular Life Sciences.
2018;
75
(18)
:
3313-27
.
View Article PubMed Google Scholar -
Greaves
P.,
Histopathology of Preclinical Toxicity Studies: Interpretation and Relevance in Drug Safety EvaluationElsevier Science Amsterdam 2000.
Google Scholar
Comments
Downloads
Article Details
Volume & Issue : Vol 7 No 2 (2020)
Page No.: 3602-3613
Published on: 2020-02-29
Citations
Copyrights & License
This work is licensed under a Creative Commons Attribution 4.0 International License.
Search Panel
Pubmed
Google Scholar
Pubmed
Google Scholar
Pubmed
Google Scholar
Pubmed
Search for this article in:
Google Scholar
Researchgate
- HTML viewed - 4018 times
- Download PDF downloaded - 1062 times
- View Article downloaded - 0 times
