

Copyrights: Phuc Hong Vo, Sinh Truong Nguyen, Nghia Minh Do, Kiet Dinh Truong, Phuc Van Pham, 2020. License: This work is licensed under a Creative Commons Attribution 4.0 International License.
Abstract
Introduction: Cancer cells rely on glycolysis to generate energy and synthesize biomass for cell growth and proliferation (the Warburg effect). Recent studies have shown that citrate has an inhibitory effect on several cancer cells, such as human gastric cancer and ovarian cancer, by inhibiting glycolysis. In this study, we investigated the effects of citrate on the proliferation and apoptosis induction of hepatocellular carcinoma cells.
Methods: HepG2 hepatocellular carcinoma cell line was used in this study. The cell proliferation was evaluated by Alamar blue assay. The apoptotic status of the HepG2 cells was recorded by Annexin V/7-AAD assay and caspase 3/7 activation assay. DNA fragmentation was evaluated by nucleus staining assay with Hoechst 33342.
Results: The results showed that citrate is able to inhibit the proliferation of HepG2 cells and induce apoptosis in these cells. The initiation time of apoptosis is 4 hours after treatment with 10 mM citrate. Morphology characteristics of DNA fragmentation and broken membranes were also recorded in the apoptotic cells.
Conclusion: In conclusion, our study demonstrates that citrate causes HepG2 cell death by the apoptosis pathway.
Introduction
The Warburg effect pathway of cancer cells was reported over 75 years ago by Otto Warburg, and is regarded as a hallmark of cancer cells. Contrary to normal cells, cancer cells metabolize glucose into lactate, although oxygen also exists in this process1. Many research studies have focused on this mechanism in order to develop new effective approaches to cancer treatment. Citrate is a precursor to the synthesis of amino acids in cell growth; moreover, citrate can also inhibit glycolysis. By adjusting the important enzymes in advance, during glycolysis (PFK1, PFK2, PK), TCA cycle (PDH, SDH), gluconeogenesis (F1, 6BPase), or amino acid synthesis (ACC), it has been confirmed that citrate is an important intermediary for cell metabolism as well as a key regulator in energy production2. When citrate is generated in the TCA cycle, it has reactions that inhibit glycolysis and this cycle, while triggering gluconeogenesis and lipid synthesis.
In 2012, Björn Kruspi et al. concluded regarding the effect of citrate in cancer cells that citrate induces the characteristic manifestations of apoptosis, such as activation of caspase-3, cleavage of polymerase polyADP-ribose, and release of cytochrome c. Some other studies have confirmed that citrate can inhibit the proliferation of various cancer cells, such as ovarian cancer, leukemia, and medullary thyroid cancer5, 4, 3. This study aimed to determine the effects of citrate on the proliferation of HepG2 cell as well as the role of apoptosis induction of citrate on HepG2 cells.
MATERIALS – METHODS
Citrate
The 1 M trisodium citrate 2-hydrate solution was made from 2.44 g of 2-hydrate trisodium citrate powder (Sigma-Aldrich, St. Louis, MO) and 10 mL of DMEM/F12 medium (Thermo Fisher Scientific, Waltham, MA). The solution was filtered with a 0.2 µm filter and then the sterile solution was kept at 4 oC until further use.
Cell culture
HepG2 cell line from ATCC (Manassas, VA, USA) was cultured in DMEM/F12 supplemented with 10 % fetal bovine serum (FBS), and 5 % antibiotic-mycotic (Thermo-Fisher Scientific). HepG2 cells were cultured in a 5 % CO2 humidified atmosphere incubator at 37 oC (Sanyo, Japan).
Cytotoxicity assay
HepG2 cells were seeded in 96 wells plate (SPL Life Sciences, Korea). The cell density was 2,500 cells per well (in 100 µL volume). After 24 h, cells were treated with citrate that was serially diluted from 60 mM to 1.5 mM. After 48 h incubation, cells were evaluated for their viability by staining with Alamar Blue and reading the measurements using a multimode reader DTX 880 machine (Beckman Coulter, CA). The experiments were done in triplicate.
Apoptosis assay
HepG2 cells were seeded in 6 wells plate (SPL Life Sciences, Korea). The cell density was 200,000 cells per well (in 1000 µL volume). The cells treated with 10 mM, 15 mM, 20 mM or 25 mM citrate and incubated for 48 h. Cells were labeled with 3 µL Annexin V-FITC (BD Biosciences, Franklin Lakes, NJ) (and 3 µl of Propidium Iodide (PI) in 500 µL of binding buffer for 15 min to detect apoptotic and necrotic cell death. The apoptotic cells were detected using a FACSCalibur flow cytometer. Data were analyzed by CellQuest Pro software (BD Biosciences, Franklin Lakes, NJ). The experiments were done in triplicate.
C aspase 3/7 activation assay
HepG2 cells were labeled with CellEvent Caspase-3/7 Green Detection Reagent (Thermo Fisher Scientific, Waltham, MA) and incubated for 30 min in a 5 % CO2 humidified atmosphere at 37 oC. Cells were captured by a Zeiss Axio Imager fluorescence microscope, at FITC filter and white light, with the timelines of 30 min, 2 h, 4 h, and 6 h, using the 10X objective. CellEvent Caspase-3/7 Green Detection Reagent is a four amino acid peptide (DEVD) associated with DNA fluorescent dye recognized by caspase 3/7. This substrate did not initially fluoresce by DEVD-based dye inhibition. The reagent traveled through the cell membrane to enter the cytoplasm. When apoptosis occurs, the DEVD peptide is separated, allowing the dye to bind to DNA and produce a fluorescent substance. This allows 3/7 caspase activity to be monitored in intact cells immediately6. The experimental study was conducted in triplicate.
Nuclei staining assay
HepG2 cells were treated with 15 mM citrate for 48 hours. They were then mixed with 100 mL Hoechst 33342 dye (Abcam, UK) and incubated for 10 min. The dyed cells were observed under the microscope (Zeiss, Germany) at fluorescence objective 50 X and 100 X.
Statistical analysis
The data from the cytotoxicity assay was calculated to derive the IC50 value. This experiment was repeated three times and processed statistically with 95% confidence intervals. The data were processed statistically by GraphPad Prism 7 software (GraphPad Software, La Jolla, CA).
RESULTS
Citrate inhibited the proliferation of HepG2 cells
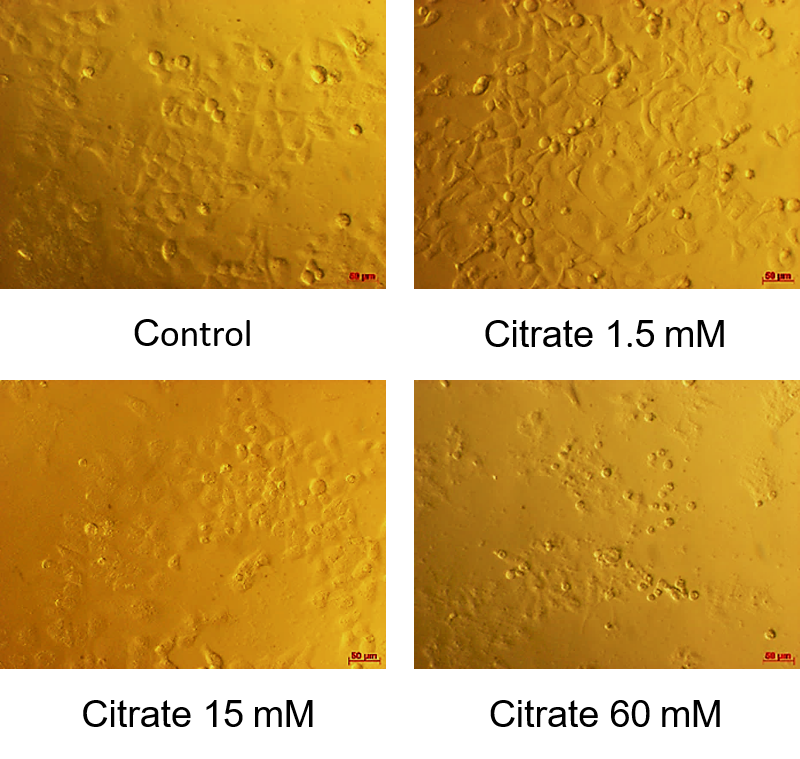
The resulting half-cell inhibitory concentration (IC50) shown in Figure 1 showed that the survival rate of HepG2 cells decreased with response to citrate concentration. The average IC50 value was 12.650 ± 0.115 mM. According to Figure 2, at a citrate concentration of 60 mM, most HepG2 cells change in morphology. They shrink, float, and form round cells. In our study, at 15 mM citrate, the percentage of cells with normal morphology and changed morphology was equivalent. For citrate at the concentration of 1.5 mM, there were few HepG2 cells in the circular form (most of the cells still clung firmly).


HepG2 cells displayed the apoptosis phenotype after treatment with citrate
HepG2 cells were treated with citrate at the concentrations of 10 mM, 15 mM, 20 mM, and 25 mM, respectively, for 48 hours. The percentage of apoptotic cells is shown in Figure 3. After 48 hours of treatment with 10 mM citrate, 6.47 % of cells were undergoing apoptosis and 2.24 % were late apoptosis or necrosis. When treated with 15 mM citrate, the percentage of cells with late apoptosis or necrosis (and early apoptosis) decreased trivially, compared to the concentration of 10 mM. This ratio was respectively 1.66 % to 5.51 %. This rate increased to 10.46% of cells with early apoptosis, or 4.24 % of cells with late apoptosis or necrosis when treating HepG2 with citrate 20 mM. At the highest concentration of citrate (25 mM), the percentage of living cells is only 50.08 %. Remarkably, the rate of cells with late apoptosis/necrosis increased dramatically to 7.63%, nearly 7 times higher than the control cells. The proportion of early apoptosis cells also accounted for the highest proportion in the treated samples (12.19 %).


The start time of the apoptosis signal was after 4 h of treatment with citrate
HepG2 cells were treated with citrate (10 mM) and monitored for time-lapse using the 10X objective with a fluorescent microscope to identify the time that treated cells began exhibiting the apoptosis phenotype. At the 30-minute mark after treatment, there was no signal of apoptosis- treated cells with 10 mM citrate. Similarly, after 2 hours, apoptosis had not even occurred in these cells. However, the signal of apoptosis started to be observed at 4 h (Figure 4). The treated cells with citrate showed bright, clear and bright green fluorescence signals. The number of apoptotic cells increased sharply compared to previous time points as well as compared to the two control samples. Positive controls (treated with doxorubicin) showed more apoptotic cells than the 2-hour mark but the incidence did not increase as much as the citrate treatment (Figure 4). Most HepG2 cells in negative control groups do not have any signal/signs of apoptosis, and only a few have fluorescence signal but are still eligible. This proves that the apoptosis recorded by the cell is due to effect of 10 mM citrate and 100 nM doxorubicin on the cell. The manipulation process does not affect the cause of apoptosis for the cell. At the 6-hour mark, cells treated with 10 mM citrate continued to increase the signal of apoptosis but the rate of growth was not as high as before. Cell samples treated with doxorubicin at 100 nM (positive control) and negative control samples still displayed similarly to the 4-hour period.
In addition, HepG2 cells after 6 hours treatment with citrate were observed under the inverted fluorescence microscopy with fluorescent filters and white light to better visualize the morphology of apoptosis cells. According to the results from Figure 5, at 10 mM citrate, the cells are transformed into round cells, accounting for about half the cell density. These round cells are mostly in the process of apoptosis. With a concentration of 100 nM of doxorubicin, the round cells induced apoptosis when combined with fluorescent light. The control sample consisted of round cells, but no fluorescence signal appeared so the cells did not die by apoptosis but could be caused by other pathways.
Nuclear fragmentation was detected when HepG2 cells were treated with citrate
Under the fluorescent light, apoptotic cells emit green fluorescence, the nucleus divides into fragments, and there is formation of individual clusters that can be clear and bright when seen with 100X objective (Figure 6) .
DISCUSSION
Following a different metabolic pathway, cancer cells tend to break down most of the glucose they get into lactate (85 %) and maintain the glycolysis process regardless of the presence of O2; this is called the Warburg pathway effect1. Understanding these characteristics of cancer cells can open the door to researching direct effects on glycolysis by potential factors, such as 3-bromopyruvate, lonidamine, 2-deoxyglucose7, and especially citrate. In life, citrate exists naturally in citrus fruits, such as oranges, lemons, and grapefruits8. In addition, sodium citrate is a compound used in foods mainly as a food additive. It is often a flavoring agent used in many types of carbonated water or preservatives. In cells, citrate is not only one of the important intermediates in cell metabolism but also a potential factor in inhibiting tumor growth2. Citrates strongly inhibit glycolysis by blocking the first PFK enzyme of glycolysis. In parallel, citrate activates new glycogen synthesis10, 9. In this study, we showed that citrate can inhibit hepatocellular carcinoma cell proliferation by inducing apoptosis in those cells.
Indeed, HepG2 cells were treated with citrate at various concentrations- from 60 mM to 1.5 mM in 48 h. The IC50 result of citrate was 12.650 ± 0.115 mM. Compared with the results of Xingyu Guo, Xiaodong Zhang et al. (2016), who researched the effects of citrate on MGC-803 stomach cancer cell lines in 48 hours, the IC50 value was 10.08 ± 0.87 mM11. The IC50 of citrate on HepG2 line in our study was found to be 1.25-fold higher than that of stomach cancer cells11.
To confirm the effects of citrate on HepG2 proliferation through activation of apoptosis, we evaluated the phenotype of apoptotic cells via the expression of Annexin-V. The results confirmed that citrate successfully induced apoptosis of HepG2 cells. Similarly, in previous studies, citrate was also known as an apoptosis inducer in some cancer cell lines, such as MGC-80311, BGC-823 and SGC-79012. In other experiments, we also showed that citrate could activate caspase 3/7 after 4 h of treatment at IC50 dose. In the last experiment, nuclear defragmentation was recorded in cells treated with citrate at IC50 dose.
CONCLUSION
This study shows that citrate could inhibit the cell proliferation of hepatocellular carcinoma cells HepG2. The cells treated with citrate completely displayed the apoptosis phenotype, such as expression of Annexin V, activation of caspase 3/7, and defragmented nuclei. This study opens up research possibilities for applying these observations to understanding the full potential and use of citrate in cancer treatment.
Abbreviations
7-AAD: 7-Aminoactinomycyna D
ACC: Acetyl-CoA carboxylase
ADP: Adenosine diphosphate
DNA: Deoxyribonucleic acid
F1,6BPase: Fructose 1,6-bisphosphatase
IC50: Inhibitory concentration 50%
PDH: Pyruvate dehydrogenase
PFK1: Phosphofructokinase
PK: Pyruvate kinase
SDH: Succinate dehydrogenase
TCA: Tricarboxylic acid
Conflict of interests
The authors report no conflicts of interest in this work.
Acknowledgments
This work was supported by the Vietnam National University, Ho Chi Minh City, Vietnam, under grant A2015-18-01.
Author’s contribution
PHV, STN, NMD performed the experiments, analyzed data and drafted the manuscript. KDT, PVP suggested the idea, explained the data, corrected the manuscript. All authors approved the final manuscript.
References
-
Warburg
O.,
On the origin of cancer cells. Science .
1956;
123
(3191)
:
309-314
.
View Article PubMed Google Scholar -
Icard
P.,
Poulain
L.,
Lincet
H.,
Understanding the central role of citrate in the metabolism of cancer cells. Biochimica et Biophysica Acta (BBA)-Reviews on Cancer.
2012;
1825
(1)
:
111-116
.
View Article PubMed Google Scholar -
Bucay
A.H.,
Hypothesis proved… citric acid (citrate) does improve cancer: a case of a patient suffering from medullary thyroid cancer. Medical hypotheses.
2009;
73
(2)
:
271
.
View Article PubMed Google Scholar -
Kruspig
B.,
Nilchian
A.,
Orrenius
S.,
Zhivotovsky
B.,
Gogvadze
V.,
Citrate kills tumor cells through activation of apical caspases. Cellular and molecular life sciences.
2012;
69
(24)
:
4229-4237
.
View Article PubMed Google Scholar -
Lincet
H.,
Kafara
P.,
Giffard
F.,
Abeilard-Lemoisson
E.,
Duval
M.,
Louis
M.H.,
Poulain
L.,
Icard
P.,
Inhibition of Mcl-1 expression by citrate enhances the effect of Bcl-x L inhibitors on human ovarian carcinoma cells. Journal of ovarian research.
2013;
6
(1)
:
72
.
View Article PubMed Google Scholar -
G.S. Salvesen,
Caspases and apoptosis. Essays In Biochemistry. 2002;
38
:
9
.
View Article PubMed Google Scholar -
López-Lázaro
M.,
The warburg effect: why and how do cancer cells activate glycolysis in the presence of oxygen?. Anti-Cancer Agents in Medicinal Chemistry (Formerly Current Medicinal Chemistry-Anti-Cancer Agents).
2008;
8
(3)
:
305-312
.
View Article PubMed Google Scholar -
Haleblian
G.E.,
Leitao
V.A.,
Pierre
S.A.,
Robinson
M.R.,
Albala
D.M.,
Ribeiro
A.A.,
Preminger
G.M.,
Assessment of citrate concentrations in citrus fruit-based juices and beverages: implications for management of hypocitraturic nephrolithiasis . Journal of endourology.
2008;
22
(6)
:
1359-1366
.
View Article PubMed Google Scholar -
Berg
J.M.,
Tymoczko
J.L.,
Stryer
L.,
Biochemistry; W. H.. New York: Freeman and Company: New York.
2002
.
-
Schwinger
A.,
The Molecular Basis of Cell Structure and Function. World Publ, New York.
1970
.
-
Guo
X.,
Zhang
X.,
Wang
T.,
Xian
S.,
Lu
Y.,
3-Bromopyruvate and sodium citrate induce apoptosis in human gastric cancer cell line MGC-803 by inhibiting glycolysis and promoting mitochondria-regulated apoptosis pathway.. Biochemical and biophysical research communications .
2016;
475
(1)
:
37-43
.
View Article PubMed Google Scholar -
Lu
Y.,
Zhang
X.,
Zhang
H.,
Lan
J.,
Huang
G.,
Varin
E.,
Lincet
H.,
Poulain
L.,
Icard
P.,
Citrate induces apoptotic cell death: a promising way to treat gastric carcinoma?. Anticancer research.
2011;
31
(3)
:
797-805
.
Comments
Article Details
Volume & Issue : Vol 7 No 3 (2020)
Page No.: 3659-3666
Published on: 2020-03-21
Citations
Copyrights & License
This work is licensed under a Creative Commons Attribution 4.0 International License.
Search Panel
Pubmed
Google Scholar
Pubmed
Google Scholar
Pubmed
Google Scholar
Pubmed
Google Scholar
Pubmed
Search for this article in:
Google Scholar
Researchgate
- HTML viewed - 6085 times
- PDF downloaded - 1178 times
- XML downloaded - 0 times
