

Copyrights: Nhan Lu-Chinh Phan, Khuong Duy Pham, Mai Thi-Thanh Nguyen, Ngoc Kim Phan, Kiet Dinh Truong, Phuc Van Pham, 2020. License: This work is licensed under a Creative Commons Attribution 4.0 International License.
Abstract
Introduction: The monolayer cell culture model is a popular model for screening anti-tumor activity of plant extracts. However, almost the extracts selected for screening in this model have failed in subsequent animal models. Therefore, there is only about 5 % of candidates from the original thousands of drugs that are screened which ultimately reach clinical trial. This study aimed to compare the differences in anti-tumor activity of 34 plant extracts against breast cancer cells in 2 models of monolayer cell culture (2D) and in three-dimensional (3D) cell culture.
Methods: Four breast cancer cell lines (MCF-7, CD44+CD24- MCF-7, VN9, and CD44+CD24- VN9) were used to generate the 2D and 3D models (the 3D model was developed by culturing breast cancer cells in matrigel). The extracts were got from the plant extract library that prepared in the previous study. The anti-tumor activity was evaluated via half inhibitory concentrations( IC50 values).
Results: Of the 34 extracts, E12, E7, E5 and E6 of them had an effect on MCF-7, CD44+CD24- MCF-7, VN9 and CD44+CD24- VN9 cells, respectively. The results indicated 10 potentially strong candidates for future drug development targeting hypoxic areas in breast cancer.
Conclusion: The 3D culture model exhibited higher resistance to extracts than the 2D culture model. The CD44+CD24- cell population of both VN9 and MCF-7 cell lines showed higher drug resistance than the original cell lines (VN9 and MCF-7).
Introduction
For the discovery of new drugs, screening of natural compounds that target the proliferation of cancer cells is important1. For libraries with hundreds to thousands of extracts, they need to be screened with high-performance screening methods. Such methods allow the screening of many compounds at different concentrations at the same time on each target cell or the combination of compounds- with uniformity and high accuracy3, 2.
Screening of extracts on cancer cell models in 2-dimensional (2D) monolayer culture is limited because the monolayer model lacks the tumor cell characteristics of physiological tumors in the body4. Meanwhile, screening done on a cancer model in 3-dimensional (3D) culture may be better for studying drug effects since the 3D culture model is more similar to the in vivo animal models (and possibly clinical trials); the 3D model more closely reflects characteristics of in vivo tumors, such as differentiation, tumor microenvironment, and distribution of hypoxia in certain populations7, 6, 5. Many methods have been developed to create 3D cells like tumors in the body; these methods include use of U-shaped bottom well , the hanging drop, and cell growth in bio-matrix8, 6.
The method of using a U-shaped bottom well is heavily used in 3D cell model studies. However, one downside is that not all cell types can develop into 3D cell mass by this method9. For hanging drop culture, the advantage is that gravity is used to precipitate the cells together and thereby stimulate the cells to stick together into 3D spheres10. This method has a disadvantage of using very gentle manipulations and is difficult to develop if screened at high throughput automation. Meanwhile, the method of using biological substrates (like Matrigel) offers great potential for the development of 3D cell model13, 12, 11. Matrigel is usually stored in frozen form, at a concentration of 10-15 mg/mL; it is thawed at 4 °C and gelated in a temperature range of 24-37 °C for 30 minutes. Matrigel promotes the differentiation of different cell lines (e.g. prostate, salivary gland, mammary epithelium, pancreas, Schwann cells, intestinal cells, and bone cells), of primary cell lines (e.g. sertoli cells, blood cells, cartilage cells, epithelial cells, endometrial cells, and fallopian epithelial cells), and even tissue explants (e.g. neural crest, immature follicles, and zygote)14.
This study used matrigel to create a 3D cell model of breast cancer for the purpose of screening natural compounds that inhibit the growth of breast cancer cell . Modeling of 2D and 3D monolayer cancer cells was carried out in parallel (simultaneously) with the same evaluation agents, including Alarma Blue. The IC50 (half maximal inhibitory concentration) values were compared between 2D and 3D cancer cell models to evaluate and select the extract which showed different effects in these two models.
This study used 34 natural plant extracts and two control drugs (Doxorubicin and Tiparazamine) on 4 cell lines (MCF-7, CD44+CD24- MCF-7, VN9, and CD44+CD24- VN9 cells).
Methods
Cell lines
MCF-7 cell line was obtained from ATCC (Manassas, VA). VN9 cell line was obtained from the Stem Cell Institute, University of Science, VNU-HCM. MCF-7 and VN9 cells were cultured in DMEM/F12 (Sigma-Aldrich, St Louis, MO), 10% fetal bovine serum (FBS) (Sigma-Aldrich, St. Louis, MO), 1% antibiotic-antimycotic (Sigma-Aldrich, St Louis, MO). The CD44+CD24- cells were sorted from VN9 cells (and termed CD44+CD24- VN9) or from MCF-7 (and termed CD44+CD24- MCF-7) by magnetic-activated cell sorting (MACS; Miltenyi Biotec, Bergisch Gladbach, Germany), and then expanded in M171 medium (Thermo Fisher Scientific, Waltham, MA) with MEGS Suplement (Thermo Fisher Scientific, Waltham, MA) for maintenance of stemness. The CD44+CD24- populations corresponded to the cancer stem cell (CSC) populations.
| Code of extract | Plant (solvent) | Code of extract | Plant (solvent) |
|---|---|---|---|
| E4 | Buchanania Latifolia – (CH3OH) | E26 | Anisoptera costata – (CH3OH) |
| E7 | M. Camptosperma – (CH3OH) | E27 | Anisoptera costata – (CH3OH) |
| E8 | D. Dyeri – (CH3OH) | E28 | Willughbeia cochinchinensis – (CH3OH) |
| E9 | H. recopei – (CH3OH) | E30 | Streblus ilicifolius – (CH3OH) |
| E10 | H. recopei – (CH3OH) | E31 | B. pandurate – (CH3OH) |
| E11 | S. thorelii – (CH3OH) | E32 | Paramignya trimera – (CH3OH) |
| E12 | S. thorelii – (CH3OH) | E35 | Mangifera mekongiensis – (CH3OH) |
| E13 | D. turbinatus – (CH3OH) | E36 | Embelia ribes – (CH3OH) |
| E14 | D. turbinatus – (CH3OH) | E37 | Willughbeia cochinchinensis – (C4H8O2) |
| E15 | D. costatus – (CH3OH) | E38 | Artocarpus heterophyllus – (C4H8O2) |
| E16 | D. costatus –(CH3OH) | E39 | Mangifera mekongiensis – (C4H8O2) |
| E17 | Hopea odorata – (CH3OH) | E40 | Taxus wallichiana – (CH2Cl2) |
| E19 | Vatica odorata – (CH3OH) | E41 | Caesalpinia sappan – (CH2Cl2) |
| E20 | Vatica odorata – (CH3OH) | E42 | Trigona minor – (Hexan) |
| E21 | Dipterocarpus alatus – (CH3OH) | E43 | B. pandurate - (Chloroform) |
| E22 | Shorea roxburghii – (CH3OH) | E45 | Swintonia floribunda – (CH3OH) |
| E25 | K. laurifolia – (CH3OH) | E46 | Mangifera reba Pierre 1897 – (CH3OH) |
Chemicals
In the research study, the library of the 34 extract (Table 1 ), which were coded with ‘E’ as the initial label (i.e. E1-E34), were obtained from the Division of Medicinal Chemistry, Faculty of Chemistry, University of Science, Vietnam National University Ho Chi Minh City, Vietnam. Doxorubicin hydrochloride and tirapazamine were purchased from Sigma-Aldrich.

Cell culture in monolayer ( 2D ) and three-dimensional ( 3D ) culture
For 2D models, single cells (MCF-7, CD44+CD24- MCF-7, VN9 or CD44+CD24- VN-9) were harvested and seeded in 96-well plates at a final density of 1000 cells per well, and grown for 5 days. Fresh medium was replenished every two days. Cancer cells were cultured in DMEM/F12, 10% FBS (Sigma-Aldirch), and 1% antibiotic-antimycotic (Sigma-Aldrich). CD44+CD24- cancer cells were cultured in M171 medium (Thermo Fisher Scientific ) with MEGS supplement (Thermo Fisher Scientific).
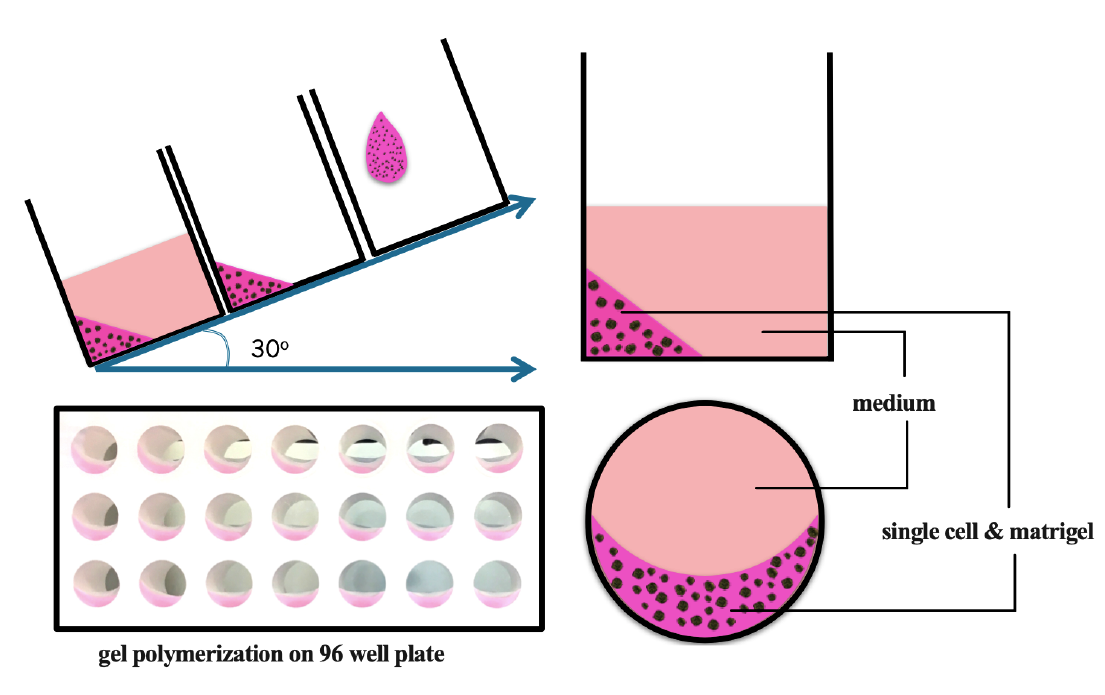
For the 3D model, 5 µL of 1000 single cells was mixed with 5 µL of matrigel (Sigma-Aldrich) on ice and placed on the edge of the well. The plate was incubated at 37 oC in 10 minutes for gel polymerization, and then 100 µL of pre-warmed medium was added on top of the gel. The pre-warmed medium was a requisite for manipulation of 3D culture to avoid melting the gel (Figure 1 ).
| Cell lines | Models | IC50 DOX (ng/mL) | IC50 TPZ (µg/mL) |
|---|---|---|---|
| VN9 | 2D | 1476 | 292 |
| 3D | 1868 | 128 | |
| CD44+CD24- VN9 | 2D | 98.52 | 315.2 |
| 3D | 1711 | 105.4 | |
| MCF-7 | 2D | 1674 | 159.4 |
| 3D | 2354 | 68.14 | |
| CD44+CD24- MCF-7 | 2D | 278.3 | 174.9 |
| 3D | 3131 | 147 |
Cell viability assay and IC50 determination
After 5 days of culture, the cells and organoids were treated for 48 hours with the respective 34 extracts at the following concentrations: 31.25 µg/ml, 62.5 µg/ml, 125 µg/ml, 250 µg/ml, 500 µg/ml, or 1000 µg/ml. The concentrations of doxorubicin evaluated were: 62.5 nM, 125 nM, 250 nM, 500 nM, and 2000 nM; the concentrations of tirapazamine evaluated were: 15.625 µM, 31.25 µM, 62.5 µM, 125 µM, 250 µM, and 500 µM. Then, Alarma Blue (Sigma-Aldrich) was added to the wells at a final concentration of 10 µg/mL and incubated in the dark for 1 hour. The fluorescence intensity was read using an DTX880 system (Beckman Coulter, Brea, CA) at excitation wavelength of 535 nm, emission wavelength of 595 nm, and integration time of 500 µs. The data were normalized to control values (untreated wells) and IC50 values were calculated with GraphPad Prism 7 (GraphPad Software, Inc., La Jolla, CA).
Statistical analysis
All experiments were performed in triplicate. Statistical significance was set at P<0.05. Data were analyzed by GraphPad Prism 7.
Results
IC50 values of extracts are different on MCF-7 2D and 3D models
The IC50 results of doxorubicin and tirapazamine showed that both 2D and 3D models were successfully established for anti-tumor activity evaluation (Table 2). The IC50 results of the 34 plant extracts on MCF-7 breast cancer cells in 2D and 3D models are summarized in Table 3.
| Extracts | IC50 values (µg/mL) | Extracts | IC50 values (µg/mL) | ||
|---|---|---|---|---|---|
| 2D model | 3D model | 2D model | 3D model | ||
| E4 | 187.5 | 383.7 | E25 | 597.4 | 870.8 |
| E7 | 248.2 | 332.8 | E27 | 165.3 | 242.5 |
| E8 | 478.7 | 533.1 | E28 | 299.7 | 673.3 |
| E9 | 701.4 | 653.5 | E30 | 1476 | 794 |
| E10 | 310 | 154.7 | E31 | 257.3 | 308.5 |
| E11 | 342.9 | 198.3 | E32 | 235.2 | 225.1 |
| E12 | 303.5 | 160.4 | E35 | 4450 | 615.9 |
| E13 | 1779 | 1061 | E36 | 2187 | 575.5 |
| E14 | 348.6 | 593 | E37 | 326.1 | 308.8 |
| E15 | 1106 | 639.8 | E38 | 368.1 | 692.2 |
| E16 | 316.8 | 361.9 | E39 | 345.6 | 270.6 |
| E17 | 159.4 | 232.4 | E40 | 70 | 1419 |
| E18 | 112.4 | 230 | E41 | 526.2 | 2063 |
| E19 | 489.5 | 621.8 | E42 | 499.7 | 359.6 |
| E20 | 86.42 | 168.4 | E43 | 306 | 620.4 |
| E21 | 57.67 | 71.97 | E45 | 155 | 361.9 |
| E22 | 83.58 | 87.92 | E46 | 135.4 | 387.6 |
| Extracts | IC50 values (µg/mL) | Extracts | IC50 values (µg/mL) | ||
|---|---|---|---|---|---|
| 2D model | 3D model | 2D model | 3D model | ||
| E4 | 66.2 | 360.3 | E25 | 173.6 | 587.8 |
| E7 | 69.42 | 307.7 | E27 | 80.45 | 214.1 |
| E8 | 103.2 | 937.8 | E28 | 134.9 | 481.6 |
| E9 | 153 | 887.8 | E30 | 508.4 | 935.9 |
| E10 | 50.48 | 162.2 | EE31 | 85.04 | 253.5 |
| E11 | 58.14 | 217.5 | E32 | 56.65 | 223 |
| E12 | 61.95 | 162 | E35 | 73.95 | 624.6 |
| E13 | 262.4 | 1243 | E36 | 507 | 1215 |
| E14 | 74.52 | 375.2 | E37 | 103.5 | 322.7 |
| E15 | 258.3 | 699.7 | E38 | 229.8 | 980.4 |
| E16 | 70.91 | 146.4 | E39 | 62.65 | 386.6 |
| E17 | 20.31 | 56.97 | E40 | 274.5 | 1648 |
| E18 | 145 | 39.89 | E41 | 303.3 | 1257 |
| E19 | 31.88 | 227.4 | E42 | 102.3 | 293.9 |
| E20 | 35.6 | 89.56 | E43 | 60.97 | 449.6 |
| E21 | 26.71 | 252.9 | E45 | 32.16 | 295.5 |
| E22 | 809.5 | 110.4 | E46 | 71.98 | 459.6 |
There were 12/34 extracts which showed effects on both 2D and 3D culture models. These 12 extracts were: E4, E10, E11, E12, E17, E18, E20, E21, E22, E27, E45, and E46. However, most of the extracts predominantly had effects on the 2D model. In fact, 27 extracts on the 3D models were correlated with increased resistance by the cancer cells as compared to the resistance on the 2D models. Specifically, there were 7 extracts that had an IC50 values in the 3D model which were lower than in the 2D culture model. The 7 extracts were: E10, E12, E15, E30, E35, E36, and E42 (Figure 2). Thus, they are potential candidates for further use in the 3D culture model of MCF-7 breast cancer.

| Cells | 2D model | 3D model | The extracts more sensitive on 3D than 2D |
|---|---|---|---|
| MCF-7 | E20, E21, E22, E40 | - | E10, E12, E15, E30, E35, E36, E42 |
| CD44+CD24-MCF-7 | E4, E7, E10, E11, E12, E14, E16, E17, E19, E20, E21, E27, E31, E32, E35, E39, E43, E45, E46 | E17, E18, E20 | E26, E22 |
| VN9 | - | - | E15, E18, E22, E30 |
| CD44+CD24-VN9 | E4, E7, E10, E11, E12, E14, E16, E17, E19, E20, E21, E31, E32, E35, E39, E45 | E7, E21 | E18, E22 |
The results of hit extracts on CD44+CD24- MCF-7 in 2D and 3D models
There were 7/34 extracts that had effects on both 2D and 3D culture models. These 7 extracts were: E7, E10, E12, E17, E18, E19, E21, and E45. However, the majority of the extracts predominantly showed effects on the 2D model (Table 5 ). As seen in Table 5, cells grown in the 3D model showed more resistance to the effects of the 32 extracts than the cells grown in the 2D model. In particular, there were 2 extracts which had IC50 values in the 3D model that were lower than the values in the 2D model; those 2 extracts were E26 and E22 (Figure 3). Therefore, they are potential candidates for further research in the 3D culture model of the MCF-7 breast cancer stem cell (CSC). Comparing with the results on the MCF-7 cell line, it was observed that the CD44+CD24- sub-population of MCF-7 cells has a much higher resistance to the same extracts tested.


| Extracts | IC50 values (µg/mL) | Extracts | IC50 values (µg/mL) | ||
|---|---|---|---|---|---|
| 2D model | 3D model | 2D model | 3D model | ||
| E4 | 238.9 | 518.2 | E25 | 4681 | 722.9 |
| E7 | 345.6 | 297 | E27 | 497.8 | 345.1 |
| E8 | 1287 | 588.2 | E28 | 1806 | 613.5 |
| E9 | 916.8 | 535.7 | E30 | 4976 | 1568 |
| E10 | 712.6 | 270.9 | E31 | 293.5 | 463.9 |
| E11 | 559.2 | 686.4 | E32 | 403.6 | 347 |
| E12 | 635.9 | 496.2 | E35 | 5799 | 3004 |
| E13 | 7756 | 2706 | E36 | 7437 | 3605 |
| E14 | 531.4 | 638.3 | E37 | 559.3 | 977.5 |
| E15 | 5744 | 1088 | E38 | 3158 | 2260 |
| E16 | 377.7 | 987.1 | E39 | 697.3 | 847.6 |
| E17 | 211 | 431 | E40 | 267.2 | 1212 |
| E18 | 2055 | 430.6 | E41 | 1083 | 871.1 |
| E19 | 357.5 | 654 | E42 | 2136 | 963.8 |
| E20 | 103.8 | 122.6 | E43 | 247.5 | 504.1 |
| E21 | 304.2 | 146.1 | E45 | 196.1 | 262 |
| E22 | 2964 | 324.1 | E46 | 1080 | 417.3 |
The results of hit extracts on VN9 cultured in 2D and 3D models
There were 5/34 extracts which showed effects on both 2D and 3D culture models. The 5 extracts were: E4, E7, E20, E21, and E45. However, most of the extracts had predominant effects on the 2D models (Table 6). As Table 6 demonstrates, 29 extracts on the 3D models were correlated with increased resistance by the cancer cells, as compared to their resistance on the 2D models. In particular, 5 extracts had IC50 values in the 3D model that were lower than the values in the 2D model. The 5 extracts were: E15, E18, E22, E25 and E30 (Figure 4). Therefore, these are potential candidates for further studies in the 3D culture model of VN9 breast cancer.
| Extracts | IC50 values (µg/mL) | Extracts | IC50 values (µg/mL) | ||
|---|---|---|---|---|---|
| 2D model | 3D model | 2D model | 3D model | ||
| E4 | 38.15 | 116.8 | E25 | 292.7 | 2456 |
| E7 | 69.24 | 74.54 | E27 | 114.4 | 402.6 |
| E8 | 112.8 | 255.3 | E28 | 108.6 | 793.3 |
| E9 | 118 | 249.6 | E30 | 915.5 | 1218 |
| E10 | 74.13 | 104 | E31 | 67.14 | 480.1 |
| E11 | 59.78 | 475 | E32 | 76.9 | 479.4 |
| E12 | 73.57 | 252.2 | E35 | 99.37 | 738.9 |
| E13 | 426.4 | 1107 | E36 | 364.7 | 1855 |
| E14 | 68.61 | 442.8 | E37 | 119.1 | 333.4 |
| E15 | 236 | 1296 | E38 | 160.5 | 1022 |
| E16 | 56.12 | 229.6 | E39 | 73.18 | 362.4 |
| E17 | 27.7 | 162.5 | E40 | 137.5 | 992.6 |
| E18 | 340.2 | 144.8 | E41 | 372.8 | 790.6 |
| E19 | 47.05 | 685.8 | E42 | 146.6 | 515 |
| E20 | 38.34 | 315.4 | E43 | 126.1 | 301.5 |
| E21 | 30.58 | 342.5 | E45 | 39.07 | 90.3 |
| E22 | 777.9 | 92.74 | E46 | 90.46 | 193 |
R esults of hit extracts on CD44+CD24- VN9 cultured in 2D and 3D
There were 6/34 extracts affected both the 2D and 3D culture models: E4, E7, E10, E12, E18, and E45. Most of the extracts, however, mainly affected the 2D models (Table 7). As shown in Table 7, 32 extracts on the 3D models were correlated with increased resistance by the cancer cells, as compared to their resistance on the 2D models. In particular, there were 2 extracts which had IC50 values in the 3D model that were lower those in the 2D culture model; these extracts were E18 and E22 (Figure 5). Thus, they are potential candidates for further studies in the 3D VN9 breast CSC model. Comparison of screening results of VN9 with CD44+CD24- phenotype versus the original VN9 demonstrated that the CSC cell line (CD44+CD24- VN9) was more resistant to the extracts in the 3D culture model. Therefore, in this study, the number of extracts tested that showed an effect on this cell line was 2, indicating that VN9 CSC can carry more resistant characteristics than normal cells.
Discussion
The use of bio-matrix substrates (such as matrigel) to create 3D culture models is very convenient for drug screening. Use of a gel forming method- that contains the cells on the side of the culture well in a 96-well plate- facilitates easy manipulation without disrupting the gel structure or limiting cell growth in the form of single layer in the center of the well. This method also allows the creation of a 3D cell mass with a size of 100 μm within 5 days of culture. The drug test is conducted in 48 hours such that the entire drug testing procedure can be summarized in 7 days. In order to minimize errors when comparing 2D and 3D models, we conducted all experiments with both models in parallel. For both 2D and 3D models, the threshold of extracting effect was lower than 200 µg/mL.
A number of published studies have show that 3D breast cell culture better reflect the histological, biological, and molecular features of primary tumors than the same cells cultured using traditional 2D techniques15. In a study by Imamura et al., on a 3D breast cancer model, the breast cell mass was found to have the presence of a hypoxic cell population7; it is for this reason that the cell mass becomes sensitive to tiparazamine. In our study, we show that 10 extracts have the same effect as tiparazamine on breast cancer cells, and that they might be suitable candidates for hypoxia-targeted drug development (Table 5). Furthermore, in their study, Imamura and colleagues also showed that expression of Ki-67 was less in 3D breast cancer cell mass than in 2D, suggesting that the greater G0-dormant subpopulation was responsible for drug resistance in 3D culture.
Many studies have show that the breast cancer cell population with phenotype CD44+CD24- possesses higher tolerability to chemotherapy, hormone therapy, and radiotherapy21, 20, 19, 18, 17, 16. Thus, for the drug screening in our study, these 4 breast cancer cell lines were suitable for our evaluations: MCF-7, CD44+CD24- MCF-7, VN9, CD44+CD24- VN9. Morever, a promising outcome from out study is the identification of 10 extracts which have a more sensitive effect on the 3D culture model than the 2D culture model. These 10 extracts include: E10, E12, E15, E18, E22, E26, E30, E35, E36, and E42. These could be suitable candidates for the next steps towards developing drugs that target the hypoxic region in breast cancer. Therapies targeting cancer cells in areas of hypoxia and studies to discern mechanisms have garnered increase interest for cancer treatment. Hypoxia-related mechanisms such as overexpression of hypoxia-inducible factor (HIF) are also important avenues of research. Inhibiting HIF activity and changing the molecules involved in HIF offer hope for identifying molecular target to inhibit tumor growth or even completely halt growth22. HIF-1 also induces an increase in adenosine 2B receptor expression, thereby promoting the enrichment of breast cancer stem cells by activating protein kinase C-δ23.
Therefore, in the study herein, it was shown that the use of a 3D model of breast cancer cell culture for drug screening reflects a huge difference in drug resistance and drug sensitivity when compared to the 2D culture model. The matrigel 3D culture model is significant for screening compounds related to hypoxia-based therapy for breast cancer.
Conclusion
Medium-throughput screening on breast cancer cell models MCF-7, CD44+CD24- MCF-7, VN9, and CD44+CD24- VN9, in 2D and 3D culture, with 34 extracts showed that resistance to these extracts occurred when cancer cells were cultured in 3D. Resistance to extracts also manifested in the CD44+CD24- cell populations (i.e. CSC populations). There were 12/34 and 7/34 extracts which affected MCF-7 and CD44 +CD24- MCF-7 cells, respectively. For the Vietnamese breast cancer cell line (VN9), there were 5/34 and 6/34 extracts which affected the VN9 and CD44+CD24- VN9 cells, respectively. Overall, our study results indicated 10 potential candidates for future drug development targeting hypoxia in breast cancer.
Abbreviations
Dox: Doxorubicin
HIF: Hypoxia-Inducible Factor
TPZ: Tirapazamine
VN9: Vietnamse breast cancer cell line #9
Conflict of interest
The authors declare that there is no conflict of interests regarding the publication of this article.
Author contributions
Nhan Phan designed the project and carried out the experiments. Khuong Pham contributed to feasibility experiments. Mai Nguyen provided the extract. Nhan Phan analyzed the data and wrote the paper with contributions from all authors. Phuc Pham, Kiet Truong and Ngoc Phan suggested the idea, corrected the scientific matters, english wording and review all paper.
Acknowledgments
This work was supported by the Vietnam National University, Ho Chi Minh City, Vietnam, under grant number A2015-18-01.
References
-
Futamura
Y.,
Yamamoto
K.,
Osada
H.,
Phenotypic screening meets natural products in drug discovery. Biosci Biotechnol Biochem.
2017;
81
(1)
:
28-31
.
View Article PubMed Google Scholar -
Alexandrov
V.,
Brunner
D.,
Hanania
T.,
Leahy
E.,
High-throughput analysis of behavior for drug discovery. Eur J Pharmacol.
2015;
750
(89)
:
82
.
View Article PubMed Google Scholar -
Mullard
A.,
Microfluidics platform lowers barrier to drug combination screening. Nat Rev Drug Discov.
2018;
17
(10)
:
691-692
.
View Article PubMed Google Scholar -
Verjans
E. T.,
Doijen
J.,
Luyten
W.,
Landuyt
B.,
Schoofs
L.,
Three-dimensional cell culture models for anticancer drug screening: Worth the effort? . J Cell Physiol.
2018;
233
(4)
:
2993-3003
.
View Article PubMed Google Scholar -
Haycock
J.W.,
3D cell culture: a review of current approaches and techniques. Methods Mol Biol.
2011;
2011
(695)
:
1-15
.
View Article PubMed Google Scholar -
Breslin
S.,
O'Driscoll
L.,
Three-dimensional cell culture: the missing link in drug discovery. Drug Discov Today.
2013;
18
(5-6)
:
240-249
.
View Article PubMed Google Scholar -
Imamura
Y.,
Mukohara
Y.,
Shimono
T.,
Funakoshi
Y.,
Chayahara
Y.,
Toyoda
N.,
Kiyota
M.,
Takao
N.,
Kono
S.,
Nakatsura
S.,
Nakatsura
T.,
Minami
H.,
Comparison of 2D- and 3D-culture models as drug-testing platforms in breast cancer. Oncol Rep.
2015;
33
(4)
:
1837-1843
.
View Article PubMed Google Scholar -
Abe-Fukasawa
Natsuki,
Otsuka
Keiichiro,
Aihara
Ayako,
Itasaki
Nobue,
Nishino
Taito,
Novel 3D Liquid Cell Culture Method for Anchorage-independent Cell Growth, Cell Imaging and Automated Drug Screening. Sci Rep.
2018;
8
(1)
:
3627
.
View Article PubMed Google Scholar -
Mittler
Frédérique,
Obeïd
Patricia,
Rulina
Anastasia V,
Haguet
Vincent,
Gidrol
Xavier,
Balakirev
Maxim Y,
High-Content Monitoring of Drug Effects in a 3D Spheroid Model. Front Oncol.
2017;
(7)
:
293
.
View Article PubMed Google Scholar -
Eder
Theresa,
Eder
Iris E,
3D Hanging Drop Culture to Establish Prostate Cancer Organoids. Methods Mol Biol.
2017;
(1612)
:
167-175
.
View Article PubMed Google Scholar -
Nguyen-Ngoc
Kim-Vy,
Shamir
Eliah R,
Huebner
Robert J,
Beck
Jennifer N,
Cheung
Kevin J,
Ewald
Andrew J,
3D culture assays of murine mammary branching morphogenesis and epithelial invasion. Methods Mol Biol.
2015;
:
135-162
.
View Article PubMed Google Scholar -
Shin
Hyun-Soo,
Hong
Hye Jin,
Koh
Won-Gun,
Lim
Jae-Yol,
Organotypic 3D Culture in Nanoscaffold Microwells Supports Salivary Gland Stem-Cell-Based Organization. ACS Biomater Sci Eng.
2018;
4
(12)
:
4311-4320
.
View Article PubMed Google Scholar -
Dolega
Monika E,
Abeille
Fabien,
Nathalie Picollet-D'hahan,
Gidrol
Xavier,
Controlled 3D culture in Matrigel microbeads to analyze clonal acinar development. Biomaterials.
2015;
:
347-357
.
View Article PubMed Google Scholar -
Kleinman
Hynda K,
Martin
George R,
Matrigel: basement membrane matrix with biological activity. Seminars in cancer biology.
2005;
15
(5)
:
378-386
.
View Article PubMed Google Scholar -
Lee
Janet Myungjin,
Mhawech-Fauceglia
Paulette,
Lee
Nathan,
Parsanian
Lucineh Cristina,
Lin
Yvonne Gail,
Gayther
Simon Andrew,
Lawrenson
Kate,
A three-dimensional microenvironment alters protein expression and chemosensitivity of epithelial ovarian cancer cells in vitro. Lab Invest.
2013;
93
(5)
:
528-42
.
View Article PubMed Google Scholar -
Palomeras
Sònia,
Ruiz-Martínez
Santiago,
Puig
Teresa,
Targeting Breast Cancer Stem Cells to Overcome Treatment Resistance. Molecules.
2018;
23
(9)
.
View Article PubMed Google Scholar -
Sun
Hongmei,
Jia
Jun,
Wang
Xiaoli,
Ma
Bo,
Di
Lijun,
Song
Guohong,
Ren
Jun,
CD44+/CD24- breast cancer cells isolated from MCF-7 cultures exhibit enhanced angiogenic properties. Clin Transl Oncol.
2013;
15
(1)
.
View Article PubMed Google Scholar -
Xinyu Deng,
Apple
Sophia,
Zhao
Hong,
Song
Jeongyoon,
Lee
Minna,
Luo
William,
Wu
Xiancheng,
Chung
Debra,
Pietras
Richard J,
Chang
Helena R,
CD24 Expression and differential resistance to chemotherapy in triple-negative breast cancer. Oncotarget.
2017;
8
(24)
:
38294-38308
.
View Article PubMed Google Scholar -
Rodríguez
Cristina E,
Berardi
Damian E,
Abrigo
Marianela,
Todaro
Laura B,
Joffé
Elisa D Bal de Kier,
Fiszman
Gabriel L,
Breast cancer stem cells are involved in Trastuzumab resistance through the HER2 modulation in 3D culture. J Cell Biochem.
2018;
119
(2)
:
1381-1391
.
View Article PubMed Google Scholar -
Chekhun
V.F.,
Lukianova
N.Yu.,
Chekhun
S.V.,
Bezdieniezhnykh
N.O.,
T.V. Zadvorniy,
Borikun
T.V. ,
Polishchuk
L.Z.,
Klyusov
O.М.,
.
Association of CD44(+)CD24(-/low) with markers of aggressiveness and plasticity of cell lines and tumors of patients with breast cancer. Exp Oncol.
2017;
39
(3)
:
203-211
.
View Article Google Scholar -
Uchiumi
Kanami,
Tsuboi
Kouki,
Nozomi Sato,
Ito
Takako,
Hirakawa
Hisashi,
Niwa
Toshifumi,
Yamaguchi
Yuri,
Hayashi
Shin-Ichi,
Cancer stem-like properties of hormonal therapy-resistant breast cancer cells. Breast Cancer.
2019;
26
(4)
:
459-470
.
View Article PubMed Google Scholar -
Badowska-Kozakiewicz
Anna Maria,
Budzik
Michal Piotr,
Przybylski
Jacek,
Hypoxia in breast cancer. Pol J Pathol.
2015;
66
(4)
:
337-346
.
View Article PubMed Google Scholar -
Lan
Jie,
Lu
Haiquan,
Samanta
Debangshu,
Salman
Shaima,
You Lu,
Semenza
Gregg L,
Hypoxia-inducible factor 1-dependent expression of adenosine receptor 2B promotes breast cancer stem cell enrichment. Proc Natl Acad Sci U S A.
;
115
(41)
:
E9640-e9648
.
View Article PubMed Google Scholar
Comments
Article Details
Volume & Issue : Vol 7 No 3 (2020)
Page No.: 3667-3677
Published on: 2020-03-22
Citations
Copyrights & License
This work is licensed under a Creative Commons Attribution 4.0 International License.
Search Panel
Pubmed
Google Scholar
Pubmed
Google Scholar
Pubmed
Google Scholar
Pubmed
Google Scholar
Pubmed
Google Scholar
Pubmed
Search for this article in:
Google Scholar
Researchgate
- HTML viewed - 6400 times
- PDF downloaded - 1182 times
- XML downloaded - 0 times
