

Copyrights: Eman Y. Morsy, Neveen L. Saad, Hesham A. Elghoneimy, Abd Alhalim G. Smeid, Azza A. Ismail, 2020. License: This work is licensed under a Creative Commons Attribution 4.0 International License.
Abstract
Background: The incidence of type 2 diabetes mellitus (T2DM) is increasing over the past years. Early identification and management of its complications, especially diabetic kidney disease (DKD), is of great importance. Multiple factors play a role in the pathogenesis of T2DM and DKD. We aimed to study Fetuin-A gene polymorphisms and Fetuin-A serum levels in T2DM patients with early DKD.
Methods: The present work was conducted on 120 patients with T2DM (60 patients with microalbuminuria and 60 without albuminuria), and 30 healthy subjects (as a control group). Serum Fetuin-A levels were measured with ELISA. Fetuin-A, Thr256Ser and Thr248Met polymorphisms were determined by PCR-RFLP.
Results: Patients with T2DM had a significantly higher mean serum Fetuin-A compared to controls (p < 0.001), while no difference was observed when comparing mean serum Fetuin-A in patients with microalbuminuria and patients without albuminuria (p = 0.916). Multivariate regression analysis demonstrated that carotid intima-media thickness (CIMT) and insulin resistance had positive correlations with serum Fetuin-A (p < 0.001 and p < 0.001, respectively). Ankle-brachial pressure index (ABPI) had a negative correlation with serum Fetuin-A (p=0.046), while Fetuin-A levels neither affected eGFR nor albuminuria. The distribution of the alleles of both polymorphisms showed increased frequency of TT (rs248) and GG (rs256) in patients without albuminuria compared to patients with microalbuminuria.
Conclusion: Increased serum Fetuin-A is associated with insulin resistance and increased risk of atherosclerosis in patients with T2DM, but is not associated with the development of DKD. TT (rs248) and GG (rs256) polymorphisms may be associated with lower risk of DKD.
Introduction
Diabetes mellitus (DM) is one of the most frequent chronic diseases worldwide. It is an important cause of morbidity and mortality in developed countries and is becoming an epidemic in developing countries1. Type 2 diabetes mellitus (T2DM) is the most prevalent form of the disease, representing 90 — 95% of cases of DM2. The frequency of chronic complications due to microvascular (e.g., diabetic kidney disease, neuropathy and retinopathy) and macrovascular (e.g., stroke, coronary artery disease and peripheral artery disease) alterations, as well as the difficulties in controlling T2DM, make it a great medical challenge3.
DM is also a strong risk factor for peripheral artery disease (PAD), including atherosclerosis in lower extremity arteries and carotid artery disease4, 5. PAD represents a significant burden to health care and is considered to be a major cause of myocardial infarction, stroke and amputation6, 7. Moreover, both DM and PVD are associated with increased long-term mortality8, 9. The cause of PAD in T2DM is multifactorial as it involves macrovascular affection, vascular inflammation, peripheral neuropathy, increased susceptibility to infections, microvascular affection, and poor wound healing10, 11.
Diabetic kidney disease (DKD) is a syndrome defined as progressive increase in the urinary albumin excretion associated with glomerular lesions, leading to loss of glomerular filtration and eventually end-stage renal disease (ESRD)12. DKD affects about 20-40% of patients with diabetes and is a leading cause of ESRD worldwide13. DKD was previously known as diabetic nephropathy but now, DKD is a broader term including not only diabetic nephropathy but also atheroembolic disease, ischemic nephropathy and interstitial fibrosis, which occur as a direct result of diabetes14.
Patients with chronic kidney disease (CKD) are more likely to develop atherosclerotic cardiovascular disease and atherosclerotic PAD than the general population with preserved kidney function15, 16. Moreover, the presence of PAD in CKD patients markedly increases the short-term risk of ischemic cardiac events and stroke17.
Albuminuria develops as a renal manifestation of generalized vascular endothelial injury, making it a valuable early predictor of atherosclerosis and cardiovascular mortality. Early identification and treatment of patients at increased risk for albuminuria may be important to limit the excess renal and cardiovascular diseases associated with type 2 diabetes18, 19.
Fetuin-A is a multifunctional plasma agent with a molecular weight of approximately 60 kDa and half-life of several days20. During fetal development, Fetuin-A is abundantly synthesized by multiple tissues. In adults, it is secreted predominantly by the liver21. Fetuin-A is a physiological inhibitor of insulin receptor tyrosine kinase, and thus is associated with insulin resistance and an increased risk for T2DM20, 21.
Moreover, Fetuin-A knockout mice demonstrated increased basal and insulin-stimulated phosphorylation of insulin receptor, increased glucose clearance, and improved insulin sensitivity22. Additionally, fetuin-null mice were protected from weight gain when they were challenged with a high-fat diet23.
Subjects — Methods
This cross-sectional case-control study was conducted on 150 subjects who were divided into three groups: group A (60 patients with T2DM and microalbuminuria), group B (60 patients with T2DM without albuminuria), and group C (30 healthy control subjects matched for age, sex and socioeconomic status).
The criteria for patients for inclusion in the study were that patients (either male or female) had T2DM disease, with or without DKD. Exclusion criteria were as follows: patients with a history of acute coronary syndrome (e.g., unstable angina, non-ST segment elevation myocardial infarction (NSTEMI), ST-segment elevation myocardial infarction (STEMI)), history and clinical examination suggestive of peripheral vascular disease, prior stroke or transient ischemic attack, endocrinal or metabolic diseases other than T2DM, gestational diabetes, type 1 diabetes, and/or severe renal or hepatic impairment.
All the participants included in the study were informed about the nature of the study, and their oral and written consent for voluntary participation in the study were obtained. The approval of the Ethics Committee of the Alexandria University, Faculty of Medicine was also obtained (project number: 0201034).
For all the subjects in our study, a full history was taken with special emphasis on different cardiovascular risk factors and detailed drug use. Complete physical examinations were done and anthropometric measurements were calculated; body mass index (BMI) was calculated as weight/height2 (in meters), and waist circumference (WC) was measured at the midpoint between the highest point of the iliac crest and lowest point of the costal margin at the end of normal expiration.
Laboratory Investigations
Early morning urine sample was obtained for complete urine analysis and assessment of urinary albumin to creatinine ratio (ACR). Urinary ACR of < 30 mg/g creatinine was categorized as normoalbuminuria, while ACR in the range of 30–300 mg/g creatinine was categorized as microalbuminuria.
Blood sampling: sampling was done in the morning (8.00 - 10.00 AM) after overnight fasting of 12 hours. Venous blood samples were withdrawn from each subject and divided into appropriate vacutainers. Serum samples were divided into a sample for assessment of total serum cholesterol, high-density lipoprotein cholesterol (HDL-C), low-density lipoprotein cholesterol (LDL-C), serum triglycerides, glycated hemoglobin (HbA1c), and fasting serum insulin level (by ELISA; kit obtained from Chemux Bioscience, Inc., San Francisco, CA, USA). Some of the serum samples were also aliquoted and stored at -80°C for further estimation of serum Fetuin-A level, as assessed using a commercially available ELISA kit (R&D Systems, Minneapolis, MN, USA).
Fetuin-A gene polymorphisms
Fetuin-A Thr256Ser and Thr248Met gene polymorphisms were determined by Polymerase chain reaction- restriction fragment length polymorphism (PCR-RFLP) assay.
DNA extraction: genomic DNA were extracted by use of Qiagen Genomic DNA Purification Kit (Qiagen, Germany).
Amplification: Fetuin-A Thr248Met and Thr256Ser polymorphisms were amplified using the primers supplied by Applied Biosystems (Thermo Fisher, CA). We received validation of the primers as part of the manufacturing process. The sequence of the primers were 5’- CCTCCCACAAGCAGAAAC -3’ / 5’- TGATGATTCCGCATACCC -3’ and 5’-TCACCCCTCCTTGTAAC-3’ / 5’- CCCCAATGAGACCACA-3’, for the Thr248Met and Thr256Ser polymorphisms, respectively. The test was done in a 50-mcL reaction volume containing approximately 65 ng of genomic DNA, 25 pmol of each primer, 1.5 U of Taq DNA polymerase (Analysis) in 1X Reaction Buffer, and 0.25 mM of each deoxynucleotide triphosphate (Analysis). The PCR conditions were as follows: initial denaturation at 95°C for 5 min, 35 cycles of denaturation at 95°C for 1 min, annealing at 56°C for 1 min, and extension at 72° C for 1 minute; followed by a final extension at 72°C for 7 min. The obtained fragments were run on agarose gel; the bands were 366-bp (for Thr248Met polymorphism) and 405 bp (for Fetuin-A Thr256Ser polymorphism).
Digestion: fragments for Thr248Met polymorphism were digested at 37 °C with 2.5 U of NlaIII overnight and separated on a 2 % agarose gel, while those for the Fetuin-A Thr256Ser polymorphism were digested at 37 °C with 5 U of SacI (restriction enzyme) overnight and separated on a 1.5 % agarose gel. For T256S, the c.766C allele remained undigested, whereas the c.766G allele yielded 193-bp and 212-bp fragments. For T248M, the c.742T allele yielded 165-bp and 201-bp fragments, whereas the c.742C allele remained undigested.
Calculations
Calculation of estimated GFR (eGFR) was done using the CKD-EPI equation24.
Assessment of insulin resistance was done using the Homeostasis Model Assessment 2 (HOMA2) calculator, released by the Diabetes Trials Unit, University of Oxford (HOMA Calculator)25.
Ankle-brachial pressure index (ABPI) was calculated as the ratio of the systolic pressure from the posterior tibial at the ankle to the systolic pressure from the brachial artery. Peripheral arterial disease (PAD) was defined as an ABPI of < 0.9 in at least one leg. The lower ABPI between the two legs was used to define PAD.
Imaging
Ultrasound on the carotid artery was done to determine the carotid intima-media thickness (CIMT).
Statistical analysis
Data were fed to the computer and analyzed using IBM SPSS software package version 20.0. (IBM Corp, Armonk, NY, USA). The Kolmogorov-Smirnov test was used to verify the normality of distribution. Statistical significance of the obtained results was set at the 5% level. Correlations between quantitative continuous variables and parameters were evaluated by multivariate regression analysis. The population of the studied sample was assessed to determine its equilibrium with the Hardy-Weinberg equation.
Results
This cross-sectional study was conducted on 120 patients with T2DM (60 patients with microalbuminuria and 60 patients without albuminuria) and 30 healthy subjects (as a control group).
General characteristics
| Cases with T2DM | Control Group | p 1 | p 2 | p 3 | ||
| With microalbuminuria | Without albuminuria | |||||
| BMI (kg/m 2 ) | ||||||
| Mean ± SD | 35.47 ± 5.18 | 36.18 ± 6.68 | 23.84 ± 1.84 | 0.754 | <0.001 | <0.001 |
| Waist hip ratio | ||||||
| Mean ± SD | 1.02 ± 0.08 | 0.99 ± 0.09 | 0.87 ± 0.05 | 0.073 | <0.001 | <0.001 |
| Systolic blood pressure (mm Hg) | ||||||
| Mean ± SD | 127.2 ± 10.55 | 123.8 ± 9.71 | 115.0 ± 7.31 | 0.145 | <0.001 | <0.001 |
| Diastolic blood pressure (mm Hg) | ||||||
| Mean ± SD | 81.50 ± 8.04 | 79.33 ± 7.33 | 73.33 ± 6.74 | 0.258 | <0.001 | <0.001 |
| Mean arterial blood pressure (mm Hg) | ||||||
| Mean ± SD | 96.45 ± 8.14 | 93.90 ± 7.42 | 86.80 ± 6.56 | 0.157 | <0.001 | <0.001 |
There was no statistically significant difference between the three groups regarding gender distribution (p = 0.149) or age (p = 0.065). Patients with T2DM had higher BMI and higher waist-hip ratio compared to control group (p < 0.001and p < 0.001, respectively). Systolic, diastolic and mean blood pressure levels were higher in patients with T2DM compared to control group (p < 0.001, p < 0.001 and p < 0.001, respectively). No significant differences regarding any of the above mentioned parameters were observed when comparing patients with T2DM and microalbuminuria to those with T2DM without albuminuria (p = 0.754, p = 0.073, p = 0.145, p = 0.258 and p = 0.157, respectively), as shown in Table 1.
Laboratory and radiological parameters
There was no significant difference regarding mean total cholesterol and mean HDL-C between the three groups (p = 0.572 and p = 0.095, respectively). However, serum triglyceride levels were significantly different between the groups; group C showed significantly lower mean serum triglyceride compared to group B and group A (p = 0.041 and p < 0.001, respectively). There was no difference between groups A and B regarding mean HbA1c percentage and mean HOMA2 (p = 0.692 and p = 0.085, respectively). Group A showed significantly lower mean eGFR compared to group B (p < 0.001). Also, group A showed higher mean albumin/creatinine ratio and higher mean fasting insulin compared to group B (p < 0.001 and p < 0.001, respectively).
Regarding mean CIMT, both groups A and B showed significantly higher mean CIMT compared to control group (p < 0.001 and p = 0.007, respectively) and group A showed significantly higher mean CIMT compared to group B (p < 0.001). Regarding mean ABPI, group C showed a significant higher mean ABPI compared to both groups A and B (p = 0.006 and p = 0.045, respectively), while no statistically significant difference regarding mean ABPI was observed between groups A and B (p = 0.671). Laboratory and radiological parameters are shown in Table 2.
| Cases with T2DM | Control Group | p 1 | p 2 | p 3 | ||
| With microalbuminuria | Without albuminuria | |||||
| Triglycerides (mg∕dl) | ||||||
| Mean ± SD | 208.5 ± 65.19 | 179.1 ± 97.89 | 136.6 ± 19.02 | < 0.001 | < 0.001 | 0.041 |
| HbA1C (%) | ||||||
| Mean ± SD | 8.77 ± 1.83 | 8.53 ± 1.70 | 5.25 ± 0.15 | 0.692 | < 0.001 | < 0.001 |
| Fasting insulin (mI/UL) | ||||||
| Mean ± SD | 84.60 ± 67.46 | 40.51 ± 35.62 | 13.56 ± 5.46 | < 0.001 | < 0.001 | < 0.001 |
| HOMA2 | ||||||
| Mean ± SD | 10.0 ± 4.25 | 7.93 ± 3.79 | 1.20 ± 0.24 | 0.085 | < 0.001 | < 0.001 |
| GFR (mL∕min - 1.73 m 2 ) | ||||||
| Mean ± SD | 73.90 ± 13.39 | 86.97 ± 17.82 | 99.39 ± 6.33 | < 0.001 | < 0.001 | < 0.001 |
| Albumin/Creatinine ratio (mg∕g) | ||||||
| Mean ± SD | 198.3 ± 56.63 | 20.92 ± 5.89 | 11.30 ± 6.97 | < 0.001 | < 0.001 | 0.001 |
| CIMT (mm) | ||||||
| Mean ± SD | 0.99 ± 0.19 | 0.83 ± 0.16 | 0.71 ± 0.15 | < 0.001 | < 0.001 | 0.007 |
| ABI | ||||||
| Mean ± SD | 0.89 ± 0.16 | 0.92 ± 0.16 | 1.0 ± 0.13 | 0.671 | 0.006 | 0.045 |
Serum Fetuin-A levels
Mean serum Fetuin-A was 528.7 ± 99.35 µg∕mL for group A, 514.2 ± 80.64 µg∕mL for group B, and 369.0 ± 79.01 µg∕mL for group C. Groups A and B showed a significant higher mean serum Fetuin-A than group C (p < 0.001 and p < 0.001, respectively), while there was no statistically significant difference between groups A and B (p = 0.916), indicating that increased serum Fetuin was present in T2DM but not related to DKD.

Correlation between serum Fetuin-A and different parameters
Regarding age, there was no significant correlation between age and serum Fetuin-A for all groups, while Fetuin-A levels seemed to be higher in females (p = 0.003). There was a statistically significant positive correlation between BMI, waist circumference, waist hip ratio, and serum Fetuin-A. Also, there were statistically significant positive correlations between HOMA2, albumin/creatinine ratio, and serum Fetuin-A. There was a statistically significant positive correlation between CIMT and serum Fetuin-A, while there was a statistically significant negative correlation between ABPI and serum Fetuin-A.
There was no significant correlation of serum Fetuin-A with mean arterial blood pressure, systolic blood pressure, diastolic blood pressure, total cholesterol, HDL-C, serum triglycerides, ALT, fasting insulin, or eGFR.
A multivariate regression analysis was done, which took into consideration all the parameters affecting serum Fetuin-A levels. The significant factors positively affecting serum Fetuin-A were found to be the following: BMI, waist circumference, waist hip ratio, HOMA2 and CIMT (p = 0.013, p = 0.011, p = 0.006, p < 0.001 and p < 0.001, respectively), while ABPI was negatively correlated with Fetuin-A levels (p = 0.046).
Fetuin gene polymorphisms frequencies in the three groups
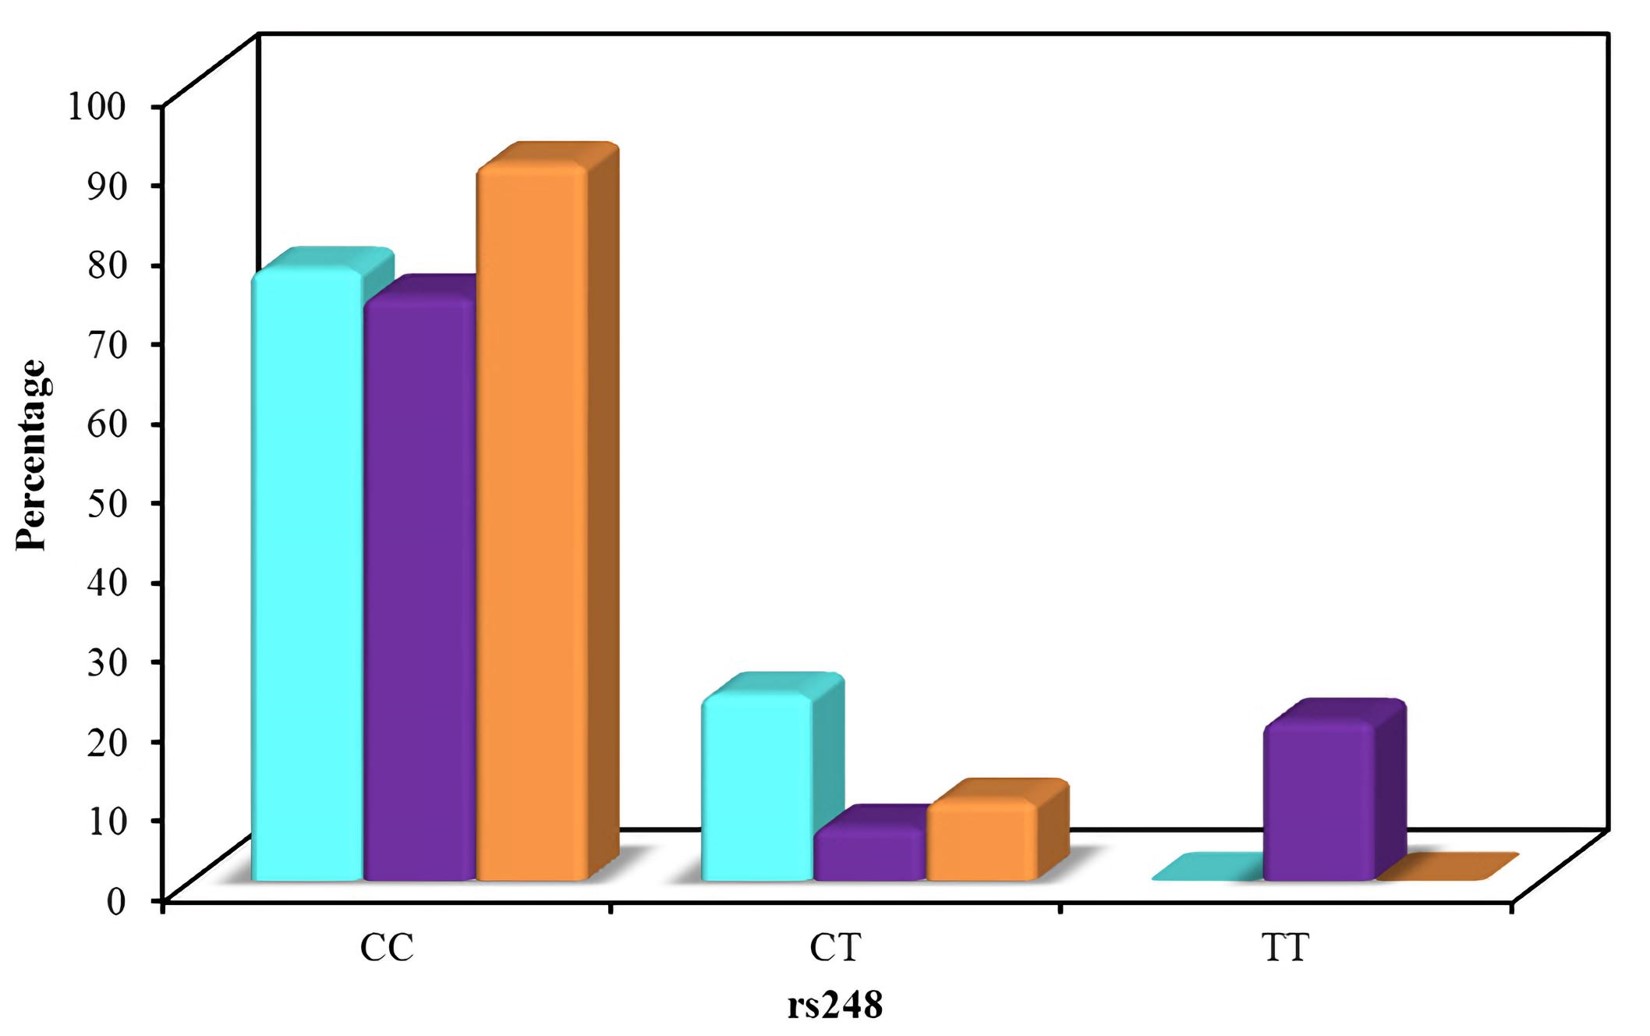
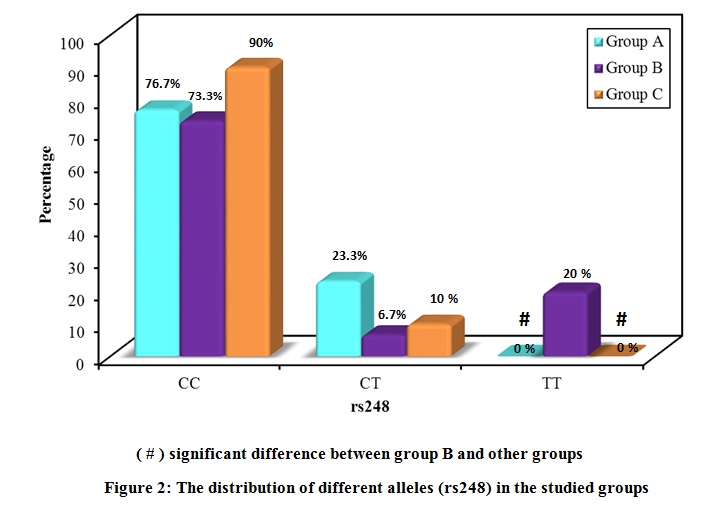
The distribution of the studied polymorphisms was consistent with the Hardy Weinberg distribution. The distribution of the different alleles in the three groups is shown in Figure 2 and Figure 3. Regarding rs248, the frequency of the CC allele was 76.7 % for group A, 73.3 % for group B, and 90.0 % for group C, with no significant difference in distribution between the groups. The frequency of the CT allele was 23.3 % for group A, 6.7 % for group B, and 10.0 % for group C. The frequency of the TT allele was 0.0 % for group A, 20.0 % for group B, and 0.0 % for group C.

Regarding rs256, the frequency of the CC allele was 73.3 % for group A, 76.7% for group B, and 80.0 % for group C. Moreover, the frequency of the CG allele was 26.7 % for group A, 6.7 % for group B, and 20.0 % for group C; the frequency of the GG allele was 0.0 % was for group A, 16.7 % for group B, and 0.0 % for group C. Upon comparing the distribution of alleles, there was a significant difference in the distribution of the alleles of both polymorphisms between groups A and B, with an increased frequency of TT in rs248 and increased frequency of GG in rs256 in group B, compared to group A. T allele (rs248) was more dominant in patients with T2DM and without proteinuria (OD of 2.304 at CI of 95%). Regarding rs256, the GG polymorphism was more dominant in patients with T2DM without albuminuria (OD of 0.24 at CI of 95%).
Serum Fetuin-A levels and different polymorphisms
Serum Fetuin-A levels were not different among subjects carrying different alleles of rs248 and rs256 polymorphisms in the three groups. Nevertheless, carriers of the T allele (CT+TT) in polymorphism rs248 and carriers of the G allele (CG+GG) in polymorphism rs256 did show higher mean serum Fetuin-A levels (p = 0.018 and p = 0.014, respectively).
Discussion
T2DM is a global pandemic that, to date, is considered to be one of the major challenges to our healthcare system. Diabetes affects every ethnic group worldwide and its prevalence is increasing- with the greatest rise in low- and middle-income countries, compared to high-income countries26. The chronic hyperglycemia observed in DM is associated with pathophysiological changes and long-term damage or dysfunction of various organs, especially the kidneys, eyes, heart, blood vessels and nerves27. In this study, we evaluated the relationship of Fetuin-A gene polymorphism and its serum level with early stages of atherosclerosis (measured by CIMT and ABPI), as well as early stages of renal disease, as predicted by estimation of ACR in patients with T2DM.
The results of the current study showed that both groups of patients with T2DM had significantly higher mean serum Fetuin-A compared to controls. Moreover, multivariate regression analysis demonstrated significant correlation between insulin resistance and serum Fetuin-A, indicating a role of Fetuin-A in insulin resistance and T2DM. These results are in agreement with multiple previous studies which demonstrated that higher circulating Fetuin-A levels were associated with insulin resistance and increased risk of T2DM28, 29, 30, 31. Fetuin-A may play a role in insulin resistance as an inhibitor of the insulin receptor tyrosine kinase activity in the muscle and in the liver, leading to inhibition of insulin signaling32.
On the other hand, no significant association was demonstrated between serum Fetuin-A levels and DKD, and no significant difference was found between serum Fetuin-A levels in patients with DKD and those without DKD. Also, neither eGFR nor albuminuria was found to be associated with serum Fetuin-A levels. In agreement with the results of our study, Jung et al.33 reported no association between serum Fetuin-A levels and microvascular complications in patients with T2DM. In contrast, Huddam et al.34 reported higher serum Fetuin-A levels in metabolic syndrome patients with microalbuminuria.
The current study showed a significant relation between serum Fetuin-A levels and obesity. There was a significant positive correlation between BMI, waist circumference, waist hip ratio, and serum Fetuin-A. Associations between Fetuin-A level and obesity-related parameters have been widely reported in previous studies35. In one study, higher Fetuin-A concentrations were associated with the accumulation of visceral adipose tissue in well-functioning, community-living older persons36. Moreover, a one-year follow-up study showed that gastric bypass surgery among morbidly obese patients resulted in reduction in the concentration of circulating Fetuin-A37.
It is thought that Fetuin-A may be related to the initiation and progression of atherosclerosis38. The results of the current study demonstrated a significant positive correlation between CIMT and serum Fetuin-A, while there was a statistically significant negative correlation between ABPI and serum Fetuin-A. These results are in agreement with those of Yin et al.38, who found that the serum Fetuin-A levels were positively and significantly correlated with CIMT in patients with newly-onset T2DM. Also, Yin et al.39 reported that plasma Fetuin-A levels were found to correlate positively and significantly with CIMT. Some previous studies demonstrated a significant association between Fetuin-A and ankle brachial index (ABI). Roos et al.40 assessed ABI as a parameter of microvascular disease and demonstrated that type 2 diabetic patients with an ABI < 0.9 had lower Fetuin-A levels than patients with an ABI 0.9-1.3 or > 1.3, and that Fetuin-A was significantly associated with ABI. Lorant et al.41 demonstrated that patients with T2DM who additionally suffered from PAD have significantly higher Fetuin-A levels.
With regards to the results of genotyping of Fetuin-A gene polymorphisms, the T allele (rs248) was more dominant in patients with T2DM and without proteinuria (OD of 2.304 at CI of 95%). Regarding rs256, GG polymorphism was more dominant in patients with T2DM without albuminuria (OD of 0.24 at CI of 95%). Very few studies explored these polymorphisms in patients with T2DM. A previous study done on an Egyptian population stated contradictory data regarding rs256 polymorphism since there were no significant differences between the two diabetic groups, with and without proteinuria, or between both of them and control, according to frequencies of the different genotypes and alleles42.
Our study showed that serum Fetuin-A levels were not different between subjects carrying different alleles of polymorphism rs248 and rs256 in the three groups. Carriers of the T allele (CT+TT) in polymorphism rs248 and carriers of G allele (CG+GG) in polymorphism rs256 showed higher mean serum Fetuin-A levels. Similarly, Pavlovic et al.43 stated that single nucleotide polymorphisms in genes for Fetuin-A, such as Thr248Met C>T (rs4917) and Thr256 Ser C>G (rs4918), were associated with lower serum Fetuin-A levels and higher mortality rate in RT and CKD patients. Stevinkel et al.44 stated that dialysis patients in Sweden showed lower serum Fetuin-A levels in Fetuin-A CG Thr256Ser polymorphism. Axelsson et al.45 concluded that Fetuin-A (C→G), Thr256Ser gene polymorphisms affected circulation of serum Fetuin-A levels. In contrast to our study, in an Indonesian population, Thr256Ser subjects with G allele (CG and GG genotypes) had lower serum Fetuin levels compared with patients with CC genotype45, 46.
Some limitations should be considered in our study. The sample size limited the power to detect the effects of the polymorphisms on microvascular complications of T2DM (rather than early DKD). This cross-sectional study could not exclude patients with non-complicated T2DM who will develop DKD later in the course of the disease. Moreover, patients with T2DM included in the study were receiving insulin or oral hypoglycemic drugs, and we cannot rule out the influence of these drugs on gene expression level.
Conclusion
Increased serum Fetuin-A is associated with insulin resistance, increased risk of atherosclerosis, and lower ABPI in patients with T2DM. There is no association between serum Fetuin-A and the development of albuminuria. T allele and GG polymorphisms in rs248 and rs256, respectively, may be associated with lower risk of development of DKD. We recommend that the relationship between polymorphisms in Fetuin-A gene and levels of Fetuin-A should be considered in different populations, and that the of level of serum Fetuin-A itself would be further studied in a larger number of patients to further confirm its effect on diabetes and its different complications.
Abbreviations
ABPI: Ankle-brachial pressure index
ACR: Albumin to creatinine ratio
BMI: Body mass index
CIMT: Carotid intima-media thickness
CKD: Chronic kidney disease
DKD: Diabetic kidney disease
HOMA2: Homeostasis Model Assessment 2
PAD: Peripheral artery disease
T2DM: Type 2 diabetes mellitus
WC: waist circumference
Acknowledgments
This work was supported by Internal Medicine Department (Diabetes Unit), Faculty of Medicine, Alexandria University, Egypt.
Author’s contributions
Study design (Eman Y. Morsy and Azza A. Ismail), Acquisition of data ( Hesham A. Elghoneimy and Abd Alhalim G. Smeida), Laboratory tests supervision (Neveen L. Saad), Analysis and interpretation of data (Azza A. Ismail), drafting the article (Neveen L. Saad and Hesham A. Elghoneimy) and critical revision of the manuscript (Eman Y. Morsy and Azza A. Ismail). All authors read and approved the final manuscript.
Funding
None.
Availability of data and materials
Data and materials used and/or analyzed during the current study are available from the corresponding author on reasonable request.
Ethics approval and consent to participate
This study was conducted in accordance with the amended Declaration of Helsinki. The institutional review board approved the study, and all participants provided written informed consent.
Consent for publication
Not applicable.
Competing interests
The authors declare that they have no competing interests.
References
-
Umpierrez GE, Reyes D, Smiley D, et al. Hospital discharge algorithm based on admission HbA1c for the management of patients with type 2 diabetes. Diabetes Care.
2014;
37
:
2934-2939
.
View Article PubMed Google Scholar -
Bandeira
S.D.M.,
Oxidative stress as an underlying contributor in the development of chronic complications in diabetes mellitus. Int J Mol Sci.
2013;
14
(2)
:
3265-3284
.
View Article PubMed Google Scholar -
Fowler MJ. Microvascular and macrovascular complications of diabetes. Clin Diabetes.
2008;
26
:
77-82
.
View Article Google Scholar -
Shah B, Rockman CB, Guo Y, Chesner J, Schwartzbard AZ, Weintraub HS, Adelman MA, Riles TS, Berger JS. Diabetes and vascular disease in different arterial territories. Diabetes care.
2014;
37
(6)
:
1636-1642
.
View Article PubMed Google Scholar -
Newman JD, Rockman CB, Kosiborod M, Guo Y, Zhong H, Weintraub HS, et al. Diabetes mellitus is a coronary heart disease risk equivalent for peripheral vascular disease. American heart journal.
2017;
184
:
114-120
.
View Article PubMed Google Scholar -
Tendera M, Aboyans V, Bartelink ML, Baumgartner I, Clément D, Collet JP, et al. European Stroke Organisation; ESC Committee for Practice Guidelines. ESC Guidelines on the diagnosis and treatment of peripheral artery diseases: Document covering atherosclerotic disease of extracranial carotid and vertebral, mesenteric, renal, upper and lower extremity arteries: the Task Force on the Diagnosis and Treatment of Peripheral Artery Diseases of the European Society of Cardiology (ESC). Eur Heart J..
2011;
32
(22)
:
2851-2906
.
-
Hirsch AT, Haskal ZJ, Hertzer NR, Bakal CW, Creager MA, Halperin JL, et al. ACC/AHA 2005 practice guidelines for the management of patients with peripheral arterial disease (lower extremity, renal, mesenteric, and abdominal aortic) a collaborative report from the American Association for Vascular Surgery/Society for Vascular Surgery,* Society for Cardiovascular Angiography and Interventions, Society for Vascular Medicine and Biology, Society of Interventional Radiology, and the ACC/AHA Task Force on Practice Guidelines (writing committee to develop guidelines for the management .... circulation. 2006;
113
(11)
:
e463-e654
.
View Article PubMed Google Scholar -
Bryan DS, Carson J, Hall H, He Q, Qato K, Lozanski L, et al. Natural history of carotid artery occlusion. Annals of vascular surgery.
2013;
27
(2)
:
186-193
.
View Article PubMed Google Scholar -
Bosevski M, Peovska I. Clinical Usefulness of Assessment of Ankle-Brachial Index and Carotid Stenosis in Type 2 Diabetic Population-Three-Year Cohort Follow-Up of Mortality. Angiology.
2013;
64
(1)
:
64-68
.
View Article PubMed Google Scholar -
Althouse AD, Abbott JD, Forker AD, Bertolet M, Barinas-Mitchell E, Thurston RC, Mulukutla S, Aboyans V, Brooks MM, BARI 2D Study Group. Risk factors for incident peripheral arterial disease in type 2 diabetes: results from the Bypass Angioplasty Revascularization Investigation in type 2 Diabetes (BARI 2D) Trial. Diabetes care.
2014;
37
(5)
:
1346-1352
.
View Article PubMed Google Scholar -
Nativel M, Potier L, Alexandre L, Baillet-Blanco L, Ducasse E, Velho G, Marre M, Roussel R, Rigalleau V, Mohammedi K. Lower extremity arterial disease in patients with diabetes: a contemporary narrative review. Cardiovascular diabetology.
2018;
17
(1)
:
138
.
View Article PubMed Google Scholar -
Lim AK. Diabetic nephropathy - complications and treatment. Int J Nephrol Renovasc.
2014;
7
:
361-381
.
View Article PubMed Google Scholar -
Tuttle KR, Bakris GL, Bilous RW, Chiang JL, de Boer IH, Goldstein-Fuchs J, et al. Diabetic kidney disease: a report from an ADA Consensus Conference. Diabetes Care.
2014;
37
(10)
:
2864-2883
.
View Article PubMed Google Scholar -
Reidy K, Kang HM, Hostetter T, and Susztak K. Molecular mechanisms of diabetic kidney disease. Journal of Clinical Investigation.
2014;
124
(6)
:
2333-2340
.
View Article PubMed Google Scholar -
Sarnak MJ, Levey AS, Schoolwerth AC, Coresh J, Culleton B, et al. Kidney disease as a risk factor for development of cardiovascular disease: a statement from the American Heart Association Councils on Kidney in Cardiovascular Disease, High Blood Pressure Research, Clinical Cardiology, and Epidemiology and Prevention. Hypertension.
2003;
42
:
1050-1065
.
View Article PubMed Google Scholar -
O'Hare AM, Glidden DV, Fox CS, Hsu CY. High prevalence of peripheral arterial disease in persons with renal insufficiency: results from the National Health and Nutrition Examination Survey 1999-2000. Circulation.
2004;
109
(3)
:
320-323
.
View Article PubMed Google Scholar -
Garimella PS, Hirsch AT. Peripheral artery disease and chronic kidney disease: clinical synergy to improve outcomes. Advances in chronic kidney disease.
2014;
21
(6)
:
460-471
.
View Article PubMed Google Scholar -
Hasan MJ, Muqueet A, Sharmeen A, Hoque MR. Prevalence of microalbuminuria in relation to glycemic control in type-2 diabetic patients in Mymensingh. Mymensingh Med J.
2015;
24
:
18-24
.
-
Yokoyama H, Sone H, Oishi M, Kawai K, Fukumoto Y, Kobayashi M, et al. Prevalence of albuminuria and renal insufficiency and associated clinical factors in type 2 diabetes: the Japan Diabetes Clinical Data Management study (JDDM15). Nephrol Dial Transplant.
2009;
24
:
1212-1219
.
View Article Google Scholar -
Wojtysiak-Duma B, Malecha Jędraszek A, Burska A, Duma D, Donica H. Serum Fetuin-A levels in patients with type 2 diabetes mellitus. Ann UMCS Sect DDD.
2010;
2
(14)
:
93-99
.
-
Stefan N, Hennige AM, Steiger H, Machann J, Schick F, Kröber SM, Machicao F, Fritsche A, Häring HU. α2-Heremans-Schmid Glycoprotein/Fetuin-A is associated with insulin resistance and fat accumulation in the liver in humans. Diabetes Care.
2006;
29
(4)
:
853-854
.
View Article PubMed Google Scholar -
Reinehr T, Roth CL. Fetuin-A and its relation to metabolic syndrome and fatty liver disease in obese children before and after weight loss. J Clin Endocrinol Metab.
2008;
93
(11)
:
4479-4485
.
View Article PubMed Google Scholar -
Ix JH, Wassel CL, Kanaya AM, Vittinghoff E, Johnson KC, Koster A, et al; Health ABC Study. Fetuin-A and incident diabetes mellitus in older persons. JAMA.
2008;
300
:
182-188
.
View Article PubMed Google Scholar -
Levey AS, Stevens LA. Estimating GFR using the CKD epidemiology collaboration (CKD-EPI) creatinine equation: more accurate GFR estimates, lower CKD prevalence estimates, and better risk predictions. American journal of kidney diseases: the official journal of the National Kidney Foundation. 2010;
55
(4)
:
622
.
View Article PubMed Google Scholar -
HOMA2 Calculator : Overview. [Accessed 12 February 2019].
.
-
Dagenais GR, Gerstein HC, Zhang X, McQueen M, Lear S, Lopez-Jaramillo P, et al. Variations in diabetes prevalence in low-, middle-, and high-income countries: results from the prospective urban and rural epidemiological study. Diabetes care.
2016;
39
(5)
:
780-787
.
View Article PubMed Google Scholar -
Barrett EJ, Liu Z, Khamaisi M, King GL, Klein R, Klein BE, et al. Diabetic microvascular disease: an endocrine society scientific statement. The Journal of Clinical Endocrinology & Metabolism.
2017;
102
(12)
:
4343-4410
.
View Article PubMed Google Scholar -
Ix JH, Biggs ML, Mukamal KJ, Kizer JR, Zieman SJ, Siscovick DS, et al. Association of Fetuin-A with incident diabetes mellitus in community-living older adults: the cardiovascular health study. Circulation.
2012;
125
(19)
:
2316-2322
.
View Article PubMed Google Scholar -
Jung CH, Kim BY, Kim CH, Kang SK, Jung SH, Mok JO. Associations of serum Fetuin-A levels with insulin resistance and vascular complications in patients with type 2 diabetes. Diab Vasc Dis Res. 2013;
10
(5)
:
459-467
.
View Article PubMed Google Scholar -
Guo VY, Cao B, Cai C, Cheng KK, Cheung BMY. Fetuin-A levels and risk of type 2 diabetes mellitus: a systematic review and meta-analysis. Acta Diabetol.
2018;
55
:
87-98
.
View Article PubMed Google Scholar -
Roshanzamir F, Miraghajani M, Rouhani MH, Mansourian M, Ghiasvand R, Safavi SM. The association between circulating Fetuin-A levels and type 2 diabetes mellitus risk: systematic review and meta-analysis of observational studies. J Endocrinol Invest.
2017 ;
41
:
33-47
.
View Article PubMed Google Scholar -
Ix JH, Sharma K. Mechanism linking obesity, chronic kidney disease and fatty liver disease: the roles of Fetuin-A , adiponectin and AMPK. J Am Soc Nephrol.
2010;
21
(3)
:
406-412
.
View Article PubMed Google Scholar -
Jung CH, Kim BY, Kim CH, Kang SK, Jung SH, Mok JO. Associations of serum Fetuin-A levels with insulin resistance and vascular complications in patients with type 2 diabetes. Diabetes and Vascular Disease Research.
2013;
10
(5)
:
459-467
.
View Article PubMed Google Scholar -
Huddam B, Azak A, Koçak G, Bayraktar N, Sezer S. The Relationship Between Serum Fetuin‐A, Cystatin‐C Levels, and Microalbuminuria in Patients With Metabolic Syndrome. Journal of clinical laboratory analysis.
2013;
27
(4)
:
317-322
.
View Article PubMed Google Scholar -
Trepanowski JF, Mey J, Varady KA. Fetuin-A : a novel link between obesity and related complications. International journal of obesity.
2015;
39
(5)
:
734-741
.
View Article PubMed Google Scholar -
Ix JH, Wassel CL, Chertow GM, Koster A, Johnson KC, Tylavsky FA, et al. Health Aging and Body Composition Study. Fetuin-A and change in body composition in older persons. The Journal of Clinical Endocrinology & Metabolism.
2009;
94
(11)
:
4492-4498
.
View Article PubMed Google Scholar -
Huang HH, Yeh C, Chen JC, Lee TH, Chen SC, Lee WJ, et al. Does bariatric surgery influence plasma levels of Fetuin-A and leukocyte cell-derived chemotaxin-2 in patients with type 2 diabetes mellitus?. PeerJ.
2018;
6
:
e4884
.
View Article PubMed Google Scholar -
Yin L, Cai WJ, Zhu LY, Li J, Su XH, Wang XL, et al. Association between Fetuin-A levels with insulin resistance and carotid intima-media thickness in patients with new-onset type 2 diabetes mellitus. Biomed Rep.
2014;
2
:
839-842
.
View Article PubMed Google Scholar -
Yin L, Cai WJ, Zhu LY, Li J, Su XH, Wang XL, et al. Association of plasma Fetuin-A and clinical characteristics in patients with new-onset type 2 diabetes mellitus. International journal of clinical and experimental medicine.
2015;
8
(1)
:
991
.
-
Roos M, Von EM, Heemann U, Rothenbacher D, Brenner H, Breitling LP, Serum FA. cardiovascular risk factors, and six-year follow-up outcome in patients with coronary heart disease. Am J Cardiol.
2010;
105
:
1666-1672
.
View Article PubMed Google Scholar -
Lorant DP, Grujicic M, Hoebaus C, Brix JM, Hoellerl F, Schernthaner G, et al. Fetuin-A levels are increased in patients with type2 diabetes and peripheral arterial disease. Diabetes Care.
2011;
34
:
156-161
.
View Article PubMed Google Scholar -
El-Batch M, Hamouda HE, Hassan SA, Mohamed WF, El-Horany HE. Preliminary study of biochemical role of serum Fetuin-A level and its gene polymorphism in diabetic patients with microalbuminuria. Journal of Diabetes, Metabolic Disorders & Control.
2015;
5
:
158-164
.
View Article Google Scholar -
Pavlovic S, Ogrizovic S, Dopsaj V, Novakovic I, Bukumiric Z, Naumovic R. ASSOCIATION OF FETUIN GENE POLYMORPHISMS WITH CORONARY ARTERY CALCIFICATIONS AND MORTALITY IN RENAL TRANSPLANT AND CHRONIC KIDNEY DISEASE PATIENTS: MP812. Nephrology Dialysis Transplantation.
2017;
32
.
View Article Google Scholar -
Stenvinkel P, Wang K, Qureshi AR, Axelsson J, Pecoits-Filho R, Gao P, et al. Low Fetuin-A levels are associated with cardiovascular death: impact of variations in the gene encoding fetuin. Kidney international.
2005;
67
(6)
:
2383-2392
.
View Article PubMed Google Scholar -
Axelsson J, Wang X, Ketteler M, Qureshi AR, Heimbürger O, Bárány P, et al. Is Fetuin-A /α2-Heremans-Schmid glycoprotein associated with the metabolic syndrome in patients with chronic kidney disease?. American journal of nephrology.
2008;
28
(4)
:
669-676
.
View Article PubMed Google Scholar -
Muzasti RA, Suhardjono S, Purwanto MB, Sembiring RJ. AHSG Thr256Ser Gene Polymorphism as a Predictor of Low Serum Fetuin-A Levels in Indonesian Maintenance Hemodialysis Patients. Open Access Macedonian Journal of Medical Sciences.
2020;
8
(A)
:
185-190
.
View Article Google Scholar
Comments
Downloads
Article Details
Volume & Issue : Vol 7 No 11 (2020)
Page No.: 4122-4131
Published on: 2020-11-29
Citations
Copyrights & License
This work is licensed under a Creative Commons Attribution 4.0 International License.
Search Panel
Pubmed
Google Scholar
Pubmed
Google Scholar
Pubmed
Google Scholar
Pubmed
Google Scholar
Pubmed
Search for this article in:
Google Scholar
Researchgate
- HTML viewed - 4229 times
- Download PDF downloaded - 1079 times
- View Article downloaded - 0 times
