

Copyrights: Ngoc Bich Vu, Minh Thi-Nguyet Nguyen, 2020. License: This work is licensed under a Creative Commons Attribution 4.0 International License.
Abstract
Introduction: Tissue engineering is a field suited for applying stem cells, besides stem cell transplantation. In the current tissue engineering approaches, stem cells are typically seeded onto a suitable scaffold and induced into specific tissues under particular conditions. However, this strategy has faced some limitations, namely that stem cell proliferation on the scaffolds' surface has been inefficient to fill the porous scaffolds to produce solid tissues. Some limitations have been improved by using stem cell spheroids on the scaffold in place of single stem cells. This study aimed to evaluate a simple and feasible method to produce spheroids of mesenchymal stem cells (MSCs) from adipose and umbilical cord tissues for use in tissue engineering.
Methods: MSCs from human adipose tissue (adipose-derived stem cells, i.e., ADSCs) and human umbilical cord tissues (umbilical cord-derived mesenchymal stem cells, i.e., UCMSCs) were isolated according to previously published protocols. To produce spheroids, ADSCs and UCMSCs were cultured in non-adherent V-bottom 96-well plate. Three cell densities were evaluated: 250 cells/well, 500 cells/well, and 1,000 cells/well. The generated spheroids were evaluated based on spheroid diameter, necrotic core formation (using propidium iodide (PI) and Hoechst 33342 staining), and spheroid structure (by Hematoxylin & Eosin staining).
Results: The results showed that at a density of 250 cells/well, spheroids were formed without necrotic cores from both ADSCs and UCMSCs. However, at a higher density, all spheroids had a necrotic core as part of the three zones (proliferating, quiescent, and necrotic zones).
Conclusion: Spheroids from ADSCs and UCMSCs can be easily produced by culturing 250 cells/well in a non-adherent V-bottom 96-well plate. This process can be scaled up by using the liquid handling robot system to load cells into the plates.
INTRODUCTION
Cell therapy and tissue engineering are considered significant advances for regenerative medicine, drug discovery, and cell-based biosensors 1. To date, most of the recent studies are often based on two-dimensional (2D) culture. However, experimental studies in 2D do not mimic the natural physiological characteristics of cells and tissues in vivo and are limited in simulating cells' interaction with their environment 2. The technological research advances in regenerative medicine have allowed the creation of three-dimensional (3D) in vitro model, which better reflect the in vivo cell signaling interactions than the 2D monolayer cell culture model 1, 3, as well as facilitating an improved microenvironment for cell growth 4. Nowadays, 3D cell culture has become a new trend in basic and applied research, with the number of studies in this area, increasing each day significantly.
Many studies on spheroid formation, evaluation, and application have been carried out on cancer cell lines, such as MCF75, 6, HCT116, HepG2, MDA-MB-2317, BT-474, T-47D, and MDA-MB-361 cells 6. However, studies on spheroid-derived mesenchymal stem cells (MSCs) have been limited. MSCs have great potential for use in regenerative medicine and tissue engineering. Indeed, MSCs derived from human adipose tissues (adipose-derived stem cells, i.e., ADSCs) and umbilical cord tissues (umbilical cord-derived mesenchymal stem cells, i.e., UCMSCs) have shown enormous potential in various applications 8. As MSCs, they possess similar essential characteristics; however, ADSCs and UCMSCs have many distinct features that affect their applications. Due to differences in the acquisition, isolation, and potential activities of ADSCs versus UCMSCs, when evaluating the efficiency of microtissue models, such as the 3D model, it is necessary to conduct a direct comparison of the two MSC sources to confirm which source is more efficient 9, 10, 11, 12.
Traditionally, engineered tissues like cartilage and bone have been produced by seeding MSCs onto a scaffold under inducible conditions. However, a new, simple, and highly efficient method has yielded engineered tissues from stem cell spheroids. Winter et al. (2003) reported on cartilage production via differentiated human stem cell spheroids 13. Moreover, Yoon et al. (2012) suggested that in spheroids, ADSCs could be triggered to undergo chondrogenesis via hypoxia-related cascades and enhanced cell-cell interactions 11. Hyaline-like cartilage tissue also could be created from ADSCs cultured on poly(L-glutamic acid)/chitosan scaffold 14 or in the porous scaffold 15. Furthermore, Stuart et al. (2017) reported that engineered cartilage could be produced at a low-cost using progenitor cell spheroids 16. Recently, our group has successfully created cartilage tissues from scaffold-free ADSC-derived spheroids 17.
Moreover, the engineered bone tissues can be produced in similar ways to engineered cartilage tissues using stem cell spheroids. In 2013, Shen et al. (2013) reported the successful production of spheroids derived from ADSCs and the ability to induce osteogenic differentiation in these spheroids 18. Laschke et al. (2014) also tried to use ADSC-derived spheroids and porous scaffolds to produce bone tissues19. Interestingly, ectopic bones could be formed in animals when engineered bones based on MSC-derived spheroids were combined with calcium phosphate microparticles and platelet-rich plasma hydrogel20.
In general, there are two main kinds of MSC-derived spheroids (scaffold-based spheroids and scaffold-free spheroids), which, to date, can be produced by various means. Methods to produce MSC-based spheroids include spontaneous formation in a 48-well plate 13, in combination with a poly(L-glutamic acid)/chitosan scaffold 14, use of a spinner flask 11, use of porous scaffold 15, hanging droplet method 18, pellet culture 21, and centrifugation 22. These methods, however, are complicated for scale-up production to obtain adequate numbers of spheroids needed for further experimentation and applications. Therefore, this study aimed to evaluate a simple method of generating MSC spheroids based on culturing the cells in non-adherent V-bottom 96-well plates and tested the scale-up process via liquid handling robots to produce a high number of spheroids.
MATERIALS – METHODS
Human adipose-derived and human umbilical cord-derived mesenchymal stem cells
The human ADSCs and human UCMSCs used in this study were previously established by our laboratory23, 24, 25, 26. The cells were thawed and characterized before use in experiments. ADSCs and UCMSCs were cultured T75 flasks containing MSCCult I medium (Regenmedlab, Ho Chi Minh City, VN). The two cell lines were allowed to proliferate in an incubator (37oC, 5% CO2), replenishing fresh MSCCult I medium every 2-3 days.
To verify their MSC phenotype, the ADSCs and UCMSCs were characterized by flow cytometry (FCM) using standard cell surface markers. Briefly, cells were detached by treatment with Deattachment Reagent (Regenmedlab, Ho Chi Minh City, VN) for 3 minutes, then resuspended in Washing Buffer (Regenmedlab, Ho Chi Minh City, VN), and centrifuged at 1,500 rpm for 5 minutes. Cell pellets were resuspended in FCM washing/staining buffer (Regenmedlab, Ho Chi Minh City, VN) and stained individually with the amount in 5 µL of the appropriate antibodies room temperature for 30 minutes. The antibodies included: CD90-PE, CD105-FITC, CD14-FITC, or CD73-PerCP-CP 5.5 (all purchased from Santa Cruz Biotechnology, Dallas, TX), or with CD34-FITC, CD45-APC, CD44-APC, and HLA-DR-FITC (all purchased from BD Biosciences, San Jose, CA). Then, 200 μl of BD FACSFlow™ Sheath Fluid (BD Biosciences) was added to each tube. The stained cells were run on a BD FACSCalibur machine (BD Biosciences) and the data analyzed using CellQuest Pro software (BD Biosciences), at a minimum of 1,000 events. Isotype controls were used for all tests.
To evaluate the in vitro differentiation potential of ADSCs and UCMSCs, the cells were cultured in 3 types of inducing media: adipogenic-, osteogenic- or chondrogenic-differentiation media. For adipogenic differentiation, the two cell lines were treated with an adipogenic-induction medium (StemPro® adipogenesis Differentiation Media) (Gibco/ ThermoFisher Scientific, Waltham, MA). The medium was changed every 6-7 days. After 12 to14 days, cell differentiation was assessed by staining with Oil Red O (Sigma Aldrich, St. Louis, MO). For osteogenic differentiation, the cells were cultured in an osteogenic-induction medium (StemPro® osteogenesis Differentiation Media) (Gibco/ ThermoFisher Scientific). The medium was replenished every seven days. On day 30, the cell differentiation was assessed by staining with Alizarin Red S (Sigma-Aldrich). Lastly, to facilitate induction into chondroblasts, the cells were treated in a chondrogenic-induction medium (StemPro® Chondrogenesis Differentiation Media) (Gibco/ ThermoFisher Scientific). The medium was replenished every seven days, and at day 30, cell differentiation was assessed by staining with Alcian Blue (Sigma-Aldrich).
Spheroid formation and characterization
Non-adherent V-bottom 96-well plates were used in our spheroid formation method. Cells were seeded at three different densities (250 cells/well, 500 cells/well, or 1,000 cells/well). The experiment was repeated at least three times for each cell density group. After seeding the cells into 96-well plates (100 μl/well in each well of a 96-well plate), the spheroid diameter was measured and recorded using the inverted microscope (Olympus, Japan). From here, we determined the optimal density of cells for spheroid seeding for the subsequent experiments.
Assessment of death and survival rates of the ADSCs and UCMSCs
After spheroid formation, the viability of ADSCs and UCMSCs was assessed by propidium iodide (PI) and Hoechst 33342 double staining; both reagents were purchased from Sigma-Aldrich. Cell samples were fixed in paraformaldehyde (PFA, 4%) (Sigma-Aldrich) and incubated for 30 minutes at 4oC. Then, the samples were rinsed in saline sodium citrate buffer (SSC, 2X) containing 0.03 M sodium citrate and 0.3 M sodium chloride (Sigma-Aldrich) to completely remove the PFA. A total of 50 μl RNase solution (Sigma-Aldrich) was added in, and the samples were incubated for 20 minutes at 37oC. After rinsing the samples with 2X SSC, 50 μl of 1 µg/mL Hoechst 33342 solution was added into each sample well and incubated at 37oC, 5% CO2. After 30 minutes, the samples were rinsed in 2X SSC following PI cell staining (with 50 μl of the final one ng/μl PI solution) for 30 minutes at 370C, 5% CO2. Finally, the samples were washed in 2X SSC several times. The spheroids were imaged using a ZEISS LSM 880 Confocal Laser Scanning Microscope (Carl-Zeiss, Germany).
Statistical analysis
The data are presented graphically as mean ± SD. GraphPad Prism software (version 7.0 for Windows; GraphPad Software, Inc., La Jolla, CA, USA) was used for statistical analysis of the results. All results were evaluated for statistical significance at a significance level of 0.05 (95% confidence level).
RESULTS
Characterization of human ADSCs and UCMSCs
The results showed that after thawing, both UCMSCs (Figure 1A) and ADSCs (Figure 1E) adhered to and spread with fibroblast-like morphology along the plastic surface of the flasks. When cultured in various differentiation media, both ADSCs and UCMSCs showed the ability to differentiate in vitro along the mesenchymal trilineage, including adipocytes, osteocytes, and chondrocytes. In the osteogenesis-inducing conditions of ADSCs (Figure 1F) and UCMSCs (Figure 1B), there was an accumulation of calcium mineralization in the extracellular matrix (ECM), as was observed by the formation of red complexes after staining with Alizarin Red dye. This showed that ADSCs and UCMSCs could differentiate into osteocytes. During the adipogenesis-inducing process, from day 8 to 14, both ADSCs (Figure 1G) and UCMSCs (Figure 1C) formed lipid droplets inside the cytoplasm, which stained positive with Oil Red O dye. This indicated that ADSCs and UCMSCs could differentiate into adipocytes. In the chondrogenesis-differentiation medium, the induced cells expressed protein aggrecans that bind with Alcian Blue dye to form blue complexes (Figure 1D, H). This showed that ADSCs and UCMSCs could differentiate into chondrocytes.


FCM analysis results showed that both ADSCs (Figure 2A) and UCMSCs (Figure 2B) were negative for CD14, CD34, CD45, and HLA–DR surface expression, with the percentages falling below 2%. However, they were positive for CD90, CD44, CD73, and CD105, with the percentages being more significant than 95%. The above results confirmed that ADSCs and UCMSCs, indeed, exhibited the surface marker phenotype of MSCs.
The spheroid -forming efficiency of ADSCs and UCMSCs
Two hours after seeding into non-adhesion 96-well plates, ADSCs were aggregated into loose clusters and allowed to settle down to the plate's bottom. Twenty-four hours later, the ADSC clusters could be formed from 3 cell densities (250, 500, and 1,000 cells/well). At this time, the cell clusters could easily be broken by mechanical impact. On day 3, the cell clusters continued to shrink in size, and the cells in the 250 cells/well and 500 cells/well density groups exhibited a spherical morphology. There was no sight of the individual cells in both of these density groups. The spherical morphology was maintained throughout the culture process. However, for the density group of 1,000 cells/well, the cells did not form a clear spherical shape.

Observing the growth size of the ADSC spheroids over a 10-day period (Figure 3S, Table 1), it is evident that in all three cell density groups, the spheroid size tended to decrease from the day 1 to day two greatly. There were significant changes (p < 0.0001) compared to the remaining days (days 3, 5, 7, and 10). At the density of 250 cells/well, the average size of spheroids decreased from 703.883 ± 70.975 µm (at day 1) to 423.847 ± 38.544 μm (at day 10). There was no statistically significant reduction in the mean spheroid size from days 3, 5, and 7 (560.501 ± 48.422 μm, 518.52 ± 47.81 μm, and 512.16 ± 39.45 μm, respectively) till day 10 (p > 0.05). At the 500 cells/well density, the spheroid size was reduced from 866.310 ± 62.546 μm (day 1) to 625.228 ± 40.207 μm (day 10). At the 1,000 cells/well density, the average spheroid size did not follow any patterns or rules. The spheroid size was 1585.381 ± 124.054 μm (at day 1), 960.75 ± 81.14 μm (at day 3), 1218.63 ± 75.18 μm (at day 5), 825.2 ± 75.82 μm (at day 7), and 624.1 ± 32.77 μm (day 10).
| Cell seed density | Spheroid size at 250 cells (µm) | Spheroid size at 500 cells (µm) | Spheroid size at 1,000 cells (µm) | |||
| Time (Day) | Mean | SD | Mean | SD | Mean | SD |
| 1 | 703.88 | 70.97 | 866.31 | 62.55 | 1585.38 | 124.05 |
| 3 | 560.50 | 48.42 | 726.66 | 71.87 | 960.70 | 81.14 |
| 5 | 518.52 | 47.81 | 769.09 | 76.73 | 1218.63 | 75.18 |
| 7 | 512.16 | 39.45 | 668.77 | 64.63 | 825.20 | 75.82 |
| 10 | 423.85 | 38.54 | 625.23 | 40.21 | 624.10 | 32.77 |
Thus, these results showed that ADSC spheroids could be formed from day three by the cell seeding densities of 250 and 500 cells/well. From day 3 to day 7 of culture, the spheroid sizes ranged from 423.85 to 560.5 µm when the cell seeding density was 250 cells/well and ranged from 625.23 to 769.09 µm when the seeding density was 500 cells/well (Figure 3S).

Meanwhile, single UCMSCs at a density of 250, 500, or 1,000 cells/well, seeded in 96-well plate (Figure 2A-C), showed aggregation at day one and formation of spheroid-like structures (Figure 4 D-F). However, some single cells or small clusters present at the outer edges of these spheroid-like structures. From day 3, the outer edges of the spheroid appeared smoother (Figure 4 G-I). There were no single cells or small clusters adhered to the spheroids. The structures were maintained until day 10 for all three densities (Figure 4 J-R).
From observing the UCMSC spheroids' growth over the 10-day period (Figure 4S; Table 2), significant differences in size could be seen for all three seeding density groups. For both the 500 cells/well and 1,000 cells/well densities, the spheroid size tended to decrease over time. At the 500 cells/well density, the average size of spheroids decreased over time- from 429.24 ± 41.71 μm (day 1) to 332 ± 30.16 μm (day 10). For the 1,000 cells/well density, the average size of spheroids decreased from 547.66 ± 50.72 μm (day 1) to 423.88 ± 40.33 μm (day 7). After that time, there was no statistically significant change in spheroid size. Particularly, at the 250 cells/well density, the average size of spheroids showed no significant change in the culture over time, with the size range being maintained from 311.3 ± 28.39 μm (day 1) to 323.2 ± 24.5 μm (day 7).
| Cell seed density | Spheroid size at 250 cells (µm) | Spheroid size at 500 cells (µm) | Spheroid size at 1,000 cells (µm) | |||
| Time (Day) | Mean | SD | Mean | SD | Mean | SD |
| 1 | 311.30 | 28.39 | 429.24 | 41.71 | 547.66 | 50.72 |
| 3 | 323.20 | 24.49 | 401.59 | 36.91 | 494.61 | 24.37 |
| 5 | 313.45 | 24.96 | 396.07 | 16.97 | 473.83 | 23.86 |
| 7 | 316.70 | 30.38 | 356.83 | 32.79 | 423.88 | 40.33 |
| 10 | 312.20 | 24.55 | 332.00 | 30.16 | 451.48 | 25.96 |
Therefore, these results show that human UCMSC spheroids could be formed from day one from all three seeding densities (250, 500, and 1,000 cells/well). The spheroid sizes were about 300 µm (for 250 cells/well density); the size reached 332 to 429.24 µm (for 500 cells/well density group), and 423.88 to 547.66 µm (for 1,000 cells/well density group) during the 10-day period.
MSC spheroid structures
On day 3, the cell distribution of ADSC spheroids for all three cell density groups (250, 500, and 1,000 cells/well) was not uniform (Figure 5A, C, and E, respectively). The cell density was still sparse, especially at the core of the spheroids. Notably, in the density of 1,000 cells/well, many small spheroids clustered to form a larger spheroid (Figure 5E). Therefore, we did not observe homogeneity in the shape or size of this group. On day 10, the distribution of cells inside the spheroids obtained from seeding densities of 250 and 500 cells/well were markedly denser (Figure 5B and D, respectively). However, at high density (1,000 cells/well), the presence of cells inside the spheroid core was not observed (Figure 5F). These results demonstrate that ADSCs were able to proliferate inside the spheroid only at lower seeding density. However, at the higher density (1,000 cells/well), cell survival inside the spheroid core was weak because there were no observed cells at the spheroid core. These findings suggest that a seeding density of 1,000 cells/well is not suitable for ADSCs to create spheroids.


For UCMSC spheroids, the cell distribution for all three density groups (250, 500, and 1,000 cells/well) at day 3 was uniform (Figure 6A, C and E, respectively). The cells were evenly distributed from inside to outside of the spheroids. Furthermore, the shape and size of the spheroids were homogeneous. The cell distribution was maintained until day 10. Indeed, on day 10, the cell compression was highest for all three density groups (250, 500, and 1,000 cells/well (Figure 6B, D, and F, respectively). These results demonstrate that UCMSCs were capable of proliferating inside the spheroids and that the cell distribution was homogeneous, spheroid shape, and size for all three density groups.
Cell survival in MSC spheroids
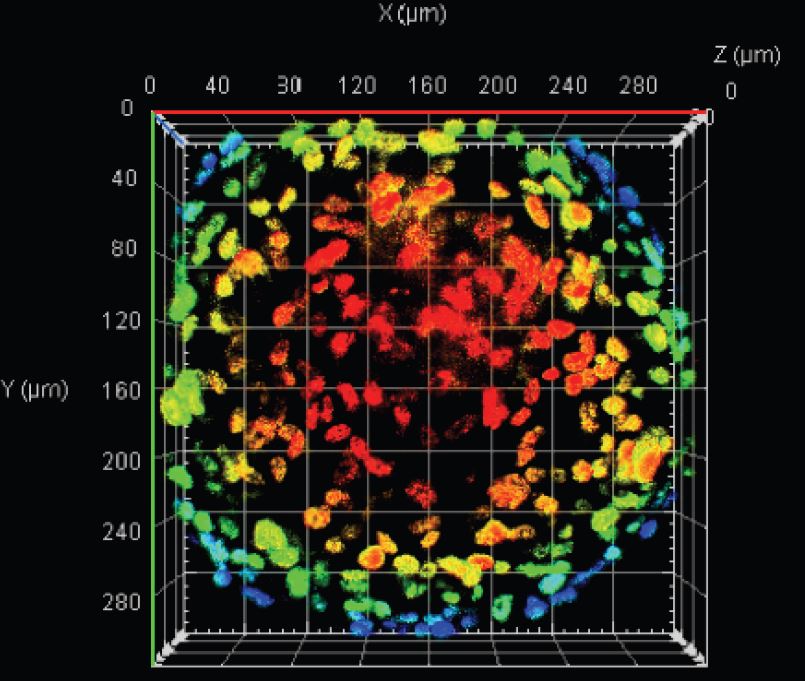
No dead cells were observed until day 10 in the ADSC spheroids at the 250 cells/well seeding density (Figure 7A-D). Indeed, 100% of the cell nuclei were stained blue with Hoechst 33342, and are shown in Figure 7A). Meanwhile, on day 10, red-colored nuclei (stained with PI) were observed in the 500 cells/well density group (Figure 7F) and 1,000 cells/well group (Figure 7K). Since the blue color represents viable cells and the red color represents dead cells, our results show that there is a high presence of dead cells in ADSC spheres- notably for the 500 cells/well seeding group but especially for the 1000 cells/well seeding group- in addition to the presence of live cells (Figure 7E-M).

For the UCMSC group, there was no presence of dead cells inside the spheroids at the 250 cells/well seeding density (Figure 8A-D). However, there were a small number of nuclei inside the spheroid center, which stained positive with PI (Figure 8F) and thus represented dead cells at the seeding density of 500 cells/well (Figure 8E-H). The percentage of dead cells was higher for the 1,000 cells/well density group (Figure 8I-M) at day 10; these results are consistent with those for ADSC spheroids.

Spheroid histology
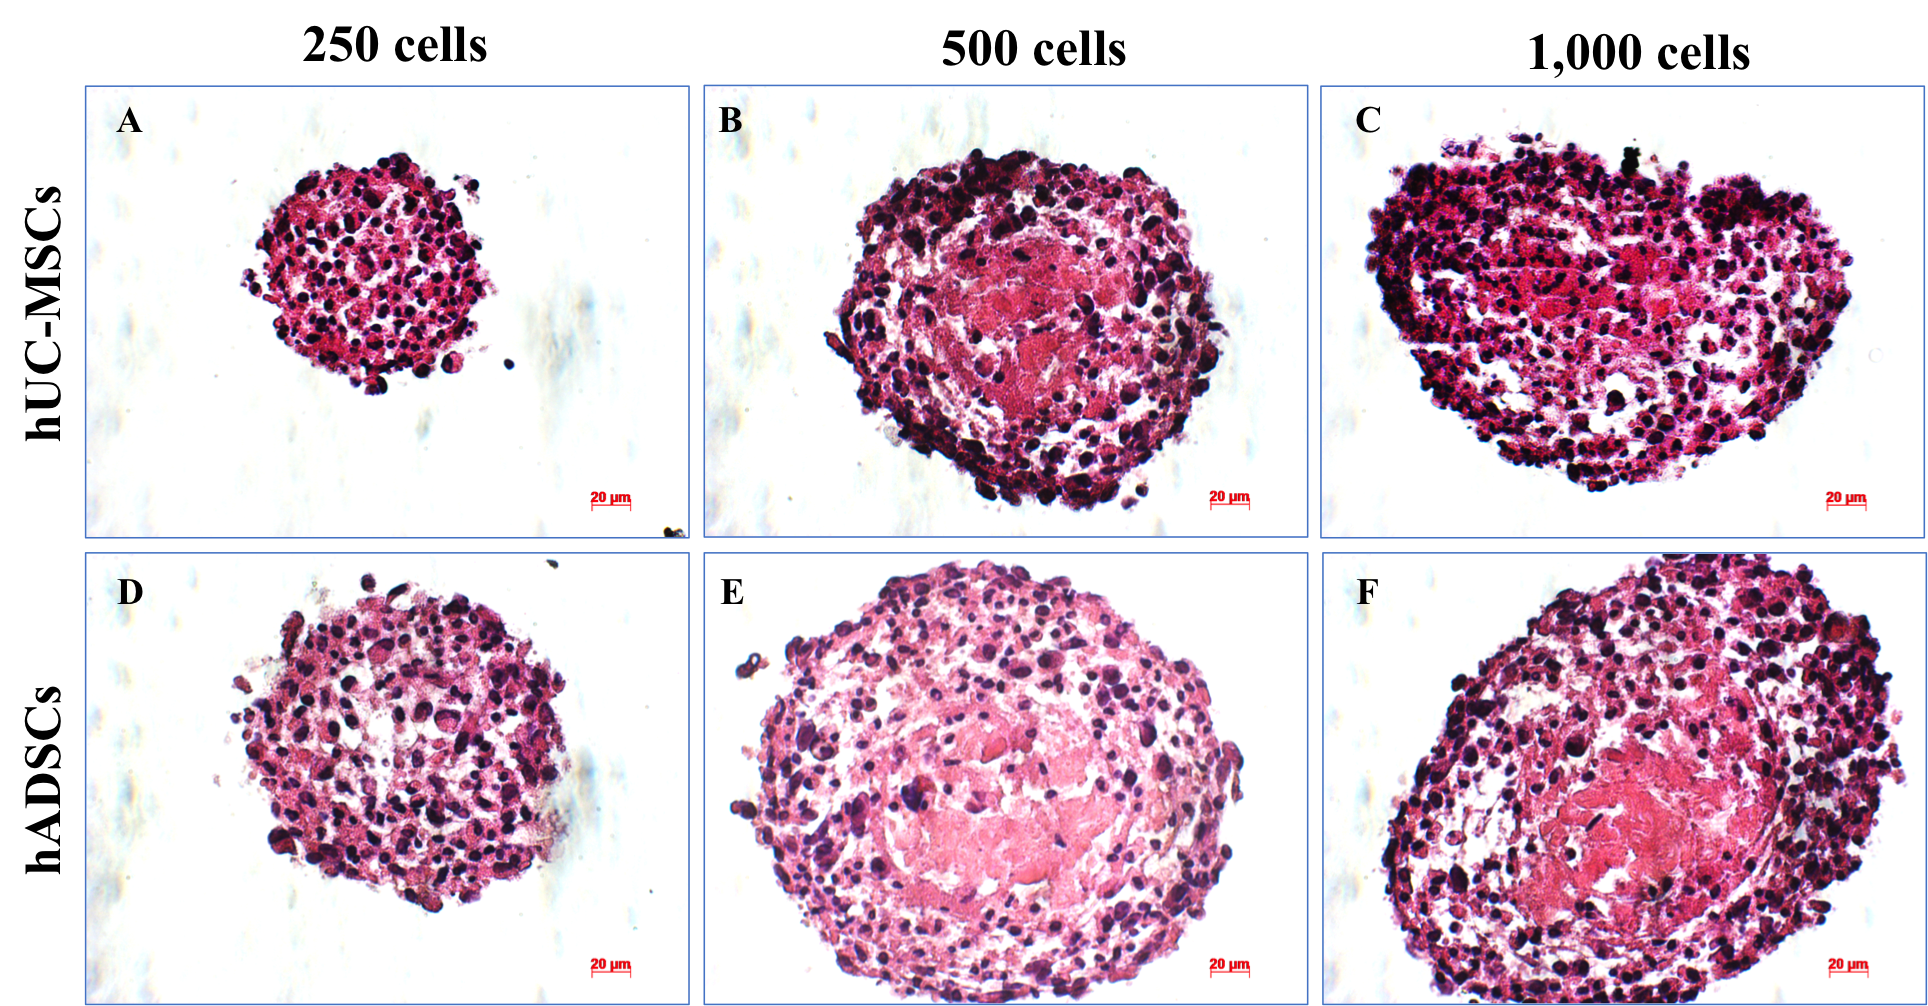
Spheroid sections were stained with H&E, revealing the distribution of mass inside the spheroids (Figure 9). H&E staining results demonstrated that on day 10, the layer of cells was arranged close together and appeared densely packed at the density of 250 cells/well- in both human ADSC (Figure 9D) and UCMSC spheroids (Figure 9A). Moreover, the spheroids generally became less spherical as spheroid diameter increased (Figure 9C, F). On the other hand, the necrotic core presence was observed at the density of 500 (Figure 9B, E) and 1000 cells/well (Figure 9C, F) in human UCMSC (Figure 9B, C) and human ADSC (Figure 9E, F) spheroid at day 10.
DISCUSSION
In the present study, we successfully produced ADSC- and UCMSC-derived spheroids and compared the efficiency of creating spheroids from these MSC sources. In the first assay, the results showed that ADSCs and UCMSCs exhibited the three minimal defining criteria for MSCs, according to the proposed guidelines of the International Society for Cellular Therapy27. First, ADSCs and UCMSCs could adhere to a plastic surface and displayed the classic fibroblast-like morphology. Second, both cell lines were positive for the expression of surface markers CD90, CD44, CD73, and CD105, but were negative for CD14, CD34, CD45, and HLA–DR. Finally, both cell lines had the ability to differentiate into other functional cells, such as adipocytes, osteocytes, and chondrocytes. These results are in accordance with published studies by Choudhery, et al. 9.
ADSCs and UCMSCs were seeded into non-adherent V-bottom 96-well plate to form spheroids. We found that at the same density, the size of ADSC spheroids is larger than that of UCMSCs; indeed, ADSC spheroids on average were twice as large as UCMSC spheroids seeded at the same density. At the density of 1,000 cells/well, the spheroid morphology of ADSCs was not defined, while for UCMSCs, the morphology was spherical. On day 3, the spheroid-like structure formation of ADSCs and UCMSCs was considered as complete. On the other hand, the ability to form UCMSC spheroids was better than that for ADSC spheroids at cell seeding densities below 1,000 cells/well.
During the ten days of culture, the spheroid size tended to decrease. However, the cell density of the spheroids tended to increase. This may be due to cell compression in the spheroid. The compactness of spheroids is thought to be based on the homophilic cadherin–cadherin binding at the membrane surface 28. E-cadherin expression is low in monolayer cell culture and high in 3D cell culture. The high expression of E-cadherin produced in cell clusters can affect the spheroid compaction 29.
On the other hand, the spheroids' volume was compressed to a certain extent, which inhibited the inner cell layer in the core from accessing nutrients and oxygen, while the CO2 concentration increased. Theoretically, this could lead to slower growth over time, and the spheroids could eventually stop growing in size by day 10. According to the research on MSC spheroids by Kaitlin C. Murphy et al. 30, cells' viability and metabolic activity decreased with increasing spheroid size (e.g., at the seeding density of 1,000 cells/well for human ADSC spheroids). Our study herein showed similar results for the seeding density of 500 and 1,000 cells/well.
Notably, at high density (1,000 cells/well), ADSC spheroid shape was not defined. This may be due to the fact that the cells were seeded in a limited environment. Thus, the outer layer can easily flake off, making it challenging for the spheroids to maintain their shape for a long period. The above analysis provides important insight into the consideration of suitable seeding densities to create the desired spheroids in the shortest period, with the maximal number of living cells and using the lowest amount of initial cells.
Spheroids were also evaluated for the ratio of live to dead cells via propidium iodide (PI)/Hoechst 33342 double staining. PI is an impermeable membrane dye that can identify dead cells with a red fluorescence 31, while the blue fluorescent Hoechst 33342 is a cell-permeable nucleic acid that is widely used to stain live cells 32. Our results showed that at the density of 250 cells/well, the survival of ADSCs and UCMSCs in spheroids is the same until day 10. At this time point (day 10), it is best to compare the two other densities (500 and 1,000 cells/well). Dead cells' presence was not observed if the initial cell seeding density was less than 250 cells/well or if the spheroid culture time was shorter than three days. However, at a density of 500 cells/well for both ADSC and UCMSC spheroid and a density of 1,000 cells/well for UCMSC spheroid , a complete spheroid was formed with a structure that included the three zones (proliferating, quiescent, and necrotic zones).
Moreover, a stable morphology was maintained until day 10. At the densities of 500 and 1,000 cells/well for the same cell culture time, the presence of viable cells in UCMSC spheroids was higher than that for ADSC spheroids. The dead cell were formed inside the center of the spheroid and dependent on initial cell density, time to culture, and spheroid diameter. The necrosis core formation is caused by the lack of nutrients and O2 in the core's inner cell layer, while CO2 concentration was increased in the core 33, 34. The dead cells inside and surrounding the necrotic core can secrete substances containing enzymes that may cause the spheroids' decomposition.
Moreover, cell-cell contact in 3D cell culture is another predominant reason for necrosis 35. At the density of 500 cells/well, for the ADSC spheroids, while there were some dead cells in the hypoxic core, the spheroids still maintained the ability to proliferate during the 10-day period. Furthermore, there was an increase in the number of cells and the size was maintained (compared to the results of the other seeding density groups); these factors can shorten the cultivation time of the spheroids and enable spheroids to form while avoiding the creation of the necrosis core.
CONCLUSION
In the present study, we successfully produced spheroids from ADSCs and UCMSCs and compared the efficiency of spheroid formation from these sources of MSCs. Overall, the results suggest that UCMSC are more effective in spheroid formation than UCMSC at each of the investigated cell densities. A necrotic core inside the spheroid was formed depending on the initial cell density, expansion time, and diameter of spheroids. Dead cells were not present in the spheroids when the initial cell seeding density was less than 250 cells/well, or when expansion time was shorter than three days. When seeding at the same density, the size of spheroids derived from ADSCs was found to be larger than that from UCMSC. Taken together, these results suggest that spheroids can be produced from ADSCs and UCMSCs, at a cell density of 250 cells/well, in non-adherent V-bottom 96-well plates. This process can be scaled-up using liquid handling robots. With the method described above, a large number of spheroids from ADSCs or UCMSCs can be generated and applied in tissue engineering as engineered cartilage or bone tissues.
ABBREVIATIONS
2D: Two-dimensional culture
3D: Three-dimensional culture
ADSCs: Human Adipose-Derived Stem Cells
ECM: Extracellular matrix
EGF: Epidermal Growth Factor
FBS: Fetal Bovine Serum
GFG: Fibroblast Growth Factor GAGs Glycosaminoglycans
HLA-DR: Human Leukocyte Antigen – antigen D Related
IBMX: 1 – methyl – 3 – isobutylxanthine
UCMSCs: Human Umbilical Cord Mesenchymal Stem Cells
SD: Standard Deviation
ACKNOWLEDGEMENTS
This research is approved by the Vietnam National University Ho Chi Minh City (VNUHCM). Authors thank Van Hanh General Hospital, Ho Chi Minh City, Viet Nam approved to use the adipose tissues from donors for the study. We thank General Hospital District 2, Ho Chi Minh City, Viet Nam approved for using the umbilical cord tissues from donors for this study.
Author’s contributions
All authors equally contributed to this study. All authors read and approved the final manuscript.
FUNDING
This research is funded by Vietnam National University Ho Chi Minh City (VNU-HCM) under grant number TX2018-18-02.
Availability of data and materials
Data and materials used and analyzed during the current study are available from the corresponding author on reasonable request.
Ethics approval and consent to participate
The institutional review board approved the use of human tissues for study.
Consent for publication
Not applicable.
Competing interests
The authors declare that they have no competing interests.
References
-
Edmondson
R.,
Three-dimensional cell culture systems and their applications in drug discovery and cell-based biosensors. Assay and drug development technologies. 2014;
12
(4)
:
207-218
.
View Article PubMed Google Scholar -
Baraniak
P.R.,
McDevitt
T.C.,
Scaffold-free culture of mesenchymal stem cell spheroids in suspension preserves multilineage potential. Cell Tissue Res. 2012;
347
(3)
:
701-711
.
View Article PubMed Google Scholar -
Antoni
D.,
Three-dimensional cell culture: a breakthrough in vivo. International journal of molecular sciences. 2015;
16
(3)
:
5517-5527
.
View Article PubMed Google Scholar -
Anderer
U.,
Libera
J.,
In vitro engineering of human autogenous cartilage. Journal of bone and mineral research. 2002;
17
(8)
:
1420-1429
.
View Article PubMed Google Scholar -
Kuo
C.T.,
Three-dimensional spheroid culture targeting versatile tissue bioassays using a PDMS-based hanging drop array. Scientific Reports. 2017;
7
(1)
:
4363
.
View Article PubMed Google Scholar -
Ivascu
A.,
Kubbies
M.,
Diversity of cell-mediated adhesions in breast cancer spheroids. Int J Oncol. 2007;
31
(6)
:
1403-1413
.
View Article PubMed Google Scholar -
Han
C.,
Takayama
S.,
Park
J.,
Formation and manipulation of cell spheroids using a density adjusted PEG/DEX aqueous two phase system. Scientific Reports.
2015;
5
:
11891
.
View Article PubMed Google Scholar -
Huselstein
C.,
Li
Y.,
He
X.,
Mesenchymal stem cells for cartilage engineering. Bio-medical materials and engineering. 2012;
22
(1-3)
:
69-80
.
View Article PubMed Google Scholar -
Choudhery
M.S.,
Comparison of human mesenchymal stem cells derived from adipose and cord tissue. Cytotherapy. 2013;
15
(3)
:
330-343
.
View Article PubMed Google Scholar -
Wang
H.S.,
Mesenchymal stem cells in the Wharton's jelly of the human umbilical cord. Stem cells. 2004;
22
(7)
:
1330-1337
.
View Article PubMed Google Scholar -
Yoon
H.H.,
Enhanced cartilage formation via three-dimensional cell engineering of human adipose-derived stem cells. Tissue Engineering Part A. 2012;
18
(19-20)
:
1949-1956
.
View Article PubMed Google Scholar -
Zuk
P.A.,
Human adipose tissue is a source of multipotent stem cells. Molecular biology of the cell. 2002;
13
(12)
:
4279-4295
.
View Article PubMed Google Scholar -
Winter
A.,
Cartilage-like gene expression in differentiated human stem cell spheroids: a comparison of bone marrow-derived and adipose tissue-derived stromal cells. Arthritis Rheum. 2003;
48
(2)
:
418-429
.
View Article PubMed Google Scholar -
Zhang
K.,
In-situ birth of MSCs multicellular spheroids in poly(L-glutamic acid)/chitosan scaffold for hyaline-like cartilage regeneration. Biomaterials. 2015;
71
:
24-34
.
View Article PubMed Google Scholar -
Zhang
K.,
Functionalized Scaffold for in Situ Efficient Gene Transfection of Mesenchymal Stem Cells Spheroids toward Chondrogenesis. ACS Appl Mater Interfaces. 2018;
10
(40)
:
33993-34004
.
View Article PubMed Google Scholar -
Stuart
M.P.,
Successful Low-Cost Scaffold-Free Cartilage Tissue Engineering Using Human Cartilage Progenitor Cell Spheroids Formed by Micromolded Nonadhesive Hydrogel. Stem Cells International. 2017;
2017
:
7053465
.
View Article PubMed Google Scholar -
Tu
V.T.K.,
Method for in production of cartilage from scaffold-free spheroids composed of human adipose-derived stem cells. Biomedical Research and Therapy.
2020;
7
(4)
:
3697-3708
.
View Article Google Scholar -
Shen
F.H.,
Implications of adipose-derived stromal cells in a 3D culture system for osteogenic differentiation: an in vitro and in vivo investigation. Spine J.
2013;
13
(1)
:
32-43
.
View Article PubMed Google Scholar -
Laschke
M.W.,
In vitro osteogenic differentiation of adipose-derived mesenchymal stem cell spheroids impairs their in vivo vascularization capacity inside implanted porous polyurethane scaffolds. Acta Biomater. 2014;
10
(10)
:
4226-4235
.
View Article PubMed Google Scholar -
Fennema
E.M.,
Ectopic bone formation by aggregated mesenchymal stem cells from bone marrow and adipose tissue: A comparative study. J Tissue Eng Regen Med. 2018;
12
(1)
:
e150-e158
.
View Article PubMed Google Scholar -
Murata
D.,
A preliminary study of osteochondral regeneration using a scaffold-free three-dimensional construct of porcine adipose tissue-derived mesenchymal stem cells. J Orthop Surg Res.
2015;
10
:
35
.
View Article PubMed Google Scholar -
Ahmad
T.,
Fabrication of in vitro 3D mineralized tissue by fusion of composite spheroids incorporating biomineral-coated nanofibers and human adipose-derived stem cells. Acta Biomater. 2018;
74
:
464-477
.
View Article PubMed Google Scholar -
Pham
P.V.,
Isolation and proliferation of umbilical cord tissue derived mesenchymal stem cells for clinical applications. Cell Tissue Bank. 2016;
17
(2)
:
289-302
.
View Article PubMed Google Scholar -
X. Cui,
Hartanto
Y.,
Zhang
H.,
Advances in multicellular spheroids formation. Journal of the Royal Society Interface.
2017;
14
(127)
:
20160877
.
View Article PubMed Google Scholar -
Truong
N.C.,
Bui
K.H.,
Pham
P.V.,
Characterization of Senescence of Human Adipose-Derived Stem Cells After Long-Term Expansion. Adv Exp Med Biol. 2019;
1084
:
109-128
.
View Article PubMed Google Scholar -
Pham
P.V.,
Good manufacturing practice-compliant isolation and culture of human adipose-derived stem cells. Biomedical Research and Therapy. 2014;
1
(04)
:
133-141
.
View Article Google Scholar -
Dominici
M.,
Minimal criteria for defining multipotent mesenchymal stromal cells. The International Society for Cellular Therapy position statement. Cytotherapy.
2006;
8
(4)
:
315-317
.
View Article PubMed Google Scholar -
Cui
X.,
Hartanto
Y.,
Zhang
H.,
Advances in multicellular spheroids formation. Journal of The Royal Society Interface. 2017;
14
(127)
:
20160877
.
View Article PubMed Google Scholar -
Schmidt
M.,
Spheroid-based 3-dimensional culture models: Gene expression and functionality in head and neck cancer. Oncol Rep. 2016;
35
(4)
:
2431-2440
.
View Article PubMed Google Scholar -
Murphy
K.C.,
Measurement of oxygen tension within mesenchymal stem cell spheroids. Journal of The Royal Society Interface. 2017;
14
(127)
:
20160851
.
View Article PubMed Google Scholar -
Boyd
V.,
Cholewa
O.M.,
Papas
K.K.,
Limitations in the Use of Fluorescein Diacetate/Propidium Iodide (FDA/PI) and Cell Permeable Nucleic Acid Stains for Viability Measurements of Isolated Islets of Langerhans. Current trends in biotechnology and pharmacy. 2008;
2
(2)
:
66-84
.
-
Rahman
S.A.,
In Vitro Morphological Assessment of Apoptosis Induced by Antiproliferative Constituents from the Rhizomes of Curcuma zedoaria. Evidence-Based Complementary and Alternative Medicine. 2013;
2013
:
14
.
View Article PubMed Google Scholar -
Xu
J.,
Vilanova
G.,
Gomez
H.,
A Mathematical Model Coupling Tumor Growth and Angiogenesis. PLoS One. 2016;
11
(2)
:
e0149422
.
View Article PubMed Google Scholar -
Barisam
M.,
Prediction of Necrotic Core and Hypoxic Zone of Multicellular Spheroids in a Microbioreactor with a U-Shaped Barrier. Micromachines. 2018;
9
(3)
:
94
.
View Article PubMed Google Scholar -
Bizik
J.,
Cell-cell contacts trigger programmed necrosis and induce cyclooxygenase-2 expression. Cell Death Differ. 2004;
11
(2)
:
183-195
.
View Article PubMed Google Scholar
Comments
Downloads
Article Details
Volume & Issue : Vol 7 No 12 (2020)
Page No.: 4139-4151
Published on: 2020-12-29
Citations
Copyrights & License
This work is licensed under a Creative Commons Attribution 4.0 International License.
Search Panel
- HTML viewed - 5678 times
- Download PDF downloaded - 852 times
- View Article downloaded - 0 times
