

Copyrights: Saravanan Dharmaraj, Rao U. S. Mahadeva, Nordin Simbak, 2021. License: This work is licensed under a Creative Commons Attribution 4.0 International License.
Abstract
Introduction: Obesity is a lifestyle disease that is becoming prevalent nowadays and is associated with a surplus in energy balance related to lipid metabolism, inflammation and hypoxic condition, resulting in maladaptive adipose tissue expansion. This study used the publicly available gene dataset to identify a small subset of important genes for diagnostics or as potential targets for therapeutics.
Methods: Chemometric analyses by principal component analysis (PCA), random forest (RF), and genetic algorithm (GA) were used to identify 50 genes that differentiate adipose samples from high-fat diet- and normal diet-fed mice. The first 30 important genes were studied for classifying the samples using six different classification techniques. Gene ontology (GO), pathway analysis, and protein-protein interaction studies on the 50 selected genes were subsequently done to identify important functional genes. Finally, gene regulatory effects by microRNA were assessed to confirm the genes’ potential as targets for new therapeutic drugs.
Results: The genes identified by RF are best for differentiating the samples, followed by PCA, with the least predictability shown by genes chosen by GA. However, PCA identified more genes with functional importance, such as the hub genes ATP5a1 and Apoa1. ATP5a1 is the main hub gene, whereas Apoa1 is involved in cholesterol metabolism. Vapa and Npc2 are crosstalk genes that link both of these main genes and could be targeted for therapeutic drug design.
Conclusion: The combination of different chemometric techniques and functional analysis of genes could be used to select for a small number of genes which could serve as more suitable diagnostic or therapeutic targets.
Introduction
Obesity is defined as an accumulation of white adipose tissue, with the disease often occurring together with hyperglycemia, hypercholesterolemia and hypertension; this cluster is often termed metabolic syndrome 1. Data analysis between 1980 and 2015 from 68.5 million persons showed an increasing prevalence of obesity and overweight condition in children and adults. In 2015, approximately 108 million children and 604 million adults were designated as obese 2.
Adipose tissue plays a key role in systemic energy homeostasis; indeed, any dysfunction involving adipocytes, such as hypertrophy, fibrosis, hypoxia and robust inflammation, is known to contribute to obesity3. The wide imbalance between energy intake and expenditure in obesity results from a combination of genetic, epigenetic, physiological, behavioral, sociocultural and environmental factors which make the diagnosis and management of obesity difficult4. Obesity can be divided into monogenic or polygenic obesity, with the monogenic type being further classified as syndromic or non-syndromic. People with monogenic obesity represent only a small percentage of the obese population, whereas common obesity with no obvious Mendelian inheritance pattern is polygenetic and highly prevalent5. It has been mentioned that for any disease, one of the greatest challenges lies not in the identification of association genes but in ascertaining the molecular mechanisms by which those factors/genes reduce the disease risk or phenotypic expression6.
The explosion of genomic data in terms of expression levels of thousands of genes from microarray studies, combined with chemometric and bioinformatic tools, has enabled the identification of candidate biomarker genes and pathways. The aim of the study was to use chemometric analyses of principal component analysis (PCA), random forest (RF), and genetic algorithm (GA) to identify a small fraction of genes that differentiate high-fat diet- and normal diet-fed adipose samples from mice using the microarray dataset GSE39549. Various classification techniques were used to check which set of genes are best for classification purposes, whereas the underlying mechanisms were studied using functional gene annotation, pathway analysis, protein-protein interaction, and miRNA regulation.
Materials - Methods
Overview of Methods
The methods' workflow consisted of dataset selection and pre-processing, selection of genes by three multivariate techniques, and evaluation of the classification accuracy of the selected genes. In addition, evaluations of the biomechanism of the genes and their potential clinical significance, functional annotation, protein-protein interaction, and miRNA-target gene interactions were conducted.
Data retrieval and pre-processing
The Gene Expression Omnibus (GEO; https://www.ncbi.nlm.nih.gov/gds), a public functional genomics data repository, was searched for ‘obesity’ and the choice of the dataset was based on an adequate number of samples. The chosen dataset of GSE 39549 was downloaded from the Gene Expression Omnibus to gain insight into the relationship between obesity and hypoxia. This dataset consisted of both adipose and liver samples from mice fed with a high-fat diet and the corresponding control diet7. The data used in this study consisted of gene expression data from the adipose samples. Microsoft Access was used to map the probe sets of the genes (which were differentially expressed by more than 2.0-fold) to Entrez Gene IDs, and the average expression values8, 9 of 15.000 genes were obtained. The original data consisted of different time points but in this study the data were pooled to compare the high-fat diet and control/normal diet. This helped overcome the dimensionality problem associated with microarray data where variables are very large but the number of samples is limited.
Software and packages
Three approaches were used to carry out the selection of genes. In the first approach, the free R package with prcomp as well as randomForest libraries were used for selecting genes by PCA and RF; conversely, GA was undertaken using Matlab R2019b. The selected variables or genes' ability to classify the samples was further carried by the use of glm and e1071 libraries in the R package. The network analysis and visualization were carried out using Cytoscape 3.72 and related apps which were downloaded from the Cytoscape website (https://cytoscape.org/). The analyses were all carried out on an Intel® Core™ i5-7400 CPU@ 3.0 GHz with 16.0 GB RAM.
Gene selection algorithms
The PCA was carried out using the prcomp function in the R program. The RF method has only a couple parameters which need to be chosen (mtry and ntree). The mtry was set to 120 and ntree was set to 1000. The GA was carried out with Matlab using the approach described previously 10, 11. The parameters chosen were the number of chromosomes of 100, ndims of 3, and the algorithm was run for 400 generations. The number of genes selected from each chemometric method was 50.
Use of machine learning for classification
The gene selection method had chosen 50 genes from either PCA, RF or GA, and the ability of the first 30 genes from each were selected for differentiating between the high-fat diet and control diet. The correct classifications were predicted using six different supervised chemometric techniques, which consisted of k-nearest neighbors (kNN), logistic regression, linear discriminant analysis, Naïve-Bayes, and two types of singular vector machines (SVM) 12, 13. The first SVM evaluator used was a non-kernel or linear-based method, whereas the second SVM used was the sigmoid-based kernel. The other parameters chosen for the above techniques were k = 5 for kNN, as well as use of the binomial option for logistic regression.
Functional enrichment and pathway analysis (Functional annotation clustering)
Functional enrichment analysis was carried on the genes chosen by the three methods by loading the selected genes into the Functional Annotation tool in the Database for Annotation Visualization and Integrated Discovery (DAVID; https://david.ncifcrf.gov/) to identify Gene Ontology (GO) functions, especially those pertinent to biological processes, molecular functions and cellular components. A total of 50 chosen genes by each method was evaluated for functional annotation, and the similarity term overlap was set to 3. The similarity threshold was 0.50, whereas p-value < 0.05 was used to obtain the optimal and statistically significant results. The enriched pathways of the genes in the Kyoto Encyclopedia of Genes and Genomes (KEGG) database were also evaluated 14.
Protein-protein interactions
The genes identified by the three methods were subjected to STRING (Search Tool for the Retrieval of Interacting Genes; https://string-db.org/) database to identify protein-protein interactions in adipose samples from high-fat diet. The confidence score of >0.4 was used to identify the protein-protein interaction networks, and the disconnected nodes were hidden in the network to simplify the resulting display15. The active interaction sources were chosen to include “textmining, experiments, databases, co-expression, neighborhood, gene fusion, and co-occurrence”. The network obtained was downloaded as tab-separated values (tsv) and processed further in Cytoscape 3.72.
The associated miRNA-gene regulatory network in humans
The genes chosen by the three different multivariate analyses also showed protein-protein interactions and were further assessed for biological meaningfulness by studying the regulatory aspect of the associated human genes by human microRNA (miRNA). The human protein-protein network associated with the mice proteins was obtained by using the STRINGIFY network function of the STRING app in Cytoscape. The miRNA-gene regulatory network in humans was obtained by extending the previous human protein-protein interaction network with CyTargetLinker16. The miRNA database chosen for this was the experimentally validated database of miRTarBase (version 4.4).
Results
Differential genes between a high-fat diet and a normal diet
The PCA showed that principal component 1 (PC1) contributed 38.2% of the overall variance and PC2 was responsible for the remaining 17.0%, whereas a total of eight principal components were required to achieve the cumulative proportion of variance of 90%. The 30 genes which had the highest loading or weightage for the first principal components were chosen for usage in classification. From their ENTREZ ID, the first six of them were identified as Mup3, Mup2, Mup1, Aldh6a1, H2-Aa and Acadsb. The mean decrease in the RF accuracy option was used to select the 30 most important genes, which were differentiated between samples from a high-fat diet and those from a normal diet. The first six of these genes were Lilrb4a, Tef, Cdt1, Adam17, Gas7, and Mlxipl. The RF used for the selection of genes had the added advantage of also classifying the samples. It had an out-of-bag (OOB) error rate of 15%. Additionally, 9 out of the 10 (or 90%) of the test samples were classified correctly when mtry of 120 and ntree of 1000 were used. The GA had to be run for 400 generations in order to pick relevant genes that had higher loads by singular vector decomposition; once again, 30 genes were chosen for classification. The first six genes were identified by their ENTREZ GENE ID as Hoxa3, Igf2r, Rassf4, Armcx1, Klf4 and Galr3.
Evaluation of classification performance
The genes selected by RF to differentiate between adipose samples from mice on normal diet or high-fat diet were tested with the six different chemometric techniques. RF gave the best correct classification compared to PCA and GA. The genes selected by RF were classified correctly in 58 out of 70 (83%) tested samples. The genes selected by PCA showed 74% correct classification, and those selected by GA showed 73% correct classification. The Naïve Bayes had the highest correct classification among the individual classification techniques as the three sets of variables had values of 85% each, and SVM using radial kernel had the next highest.
Gene ontology and pathway analyses
The functional annotation of genes using an online DAVID database showed that the genes obtained by PCA were more associated with GO terms of molecular functioning, biological processes, and cellular components related to lipid metabolism, as compared to the two other selection methods. The related GO terms, percentage of genes identified, and P-values are shown in Table 1. The genes chosen by PCA that are associated with GO annotations of ‘insulin activated receptor activity’ to ‘negative regulation of lipid metabolic processes’, as shown in Table 1, are the following: Mup1, Mup2 and Mup3. The three genes associated with GO annotation linked with cholesterol, such as ‘cholesterol transport’ to ‘cholesterol metabolic process’ are Apoa1, Apoa2 and Npc2. The genes chosen by RF had one term directly related to obesity: the GO term of ‘lipid metabolic process’; the five genes associated with it are sphingomyelin phosphodiesterase 3 (Spmd3), ATP citrate lyase (Acly), Spmd13b, 1β-Hydroxysteroid dehydrogenase type 1 (Hsd11b1) and alpha/beta hydrolase domain containing 3 (Abhd3). The genes obtained by GA did not have any GO term related to molecular function or biological function, but the term ‘extracellular exosome’ under cellular component was the only term with an enrichment score above the value of 1 and a probability value under 0.05. The three genes out of nine associated with the term are Aldh16a1, Igf2r, and Hsp90aa1. The KEGG analysis revealed that only genes selected by PCA were significantly enriched. The two pathways that were enriched were mmu03010 (ribosome underclass of translation in genetic information processing) and mmu00280 (valine, leucine and isoleucine degradation underclass of amino acid metabolism).


Protein-protein interaction and hub genes
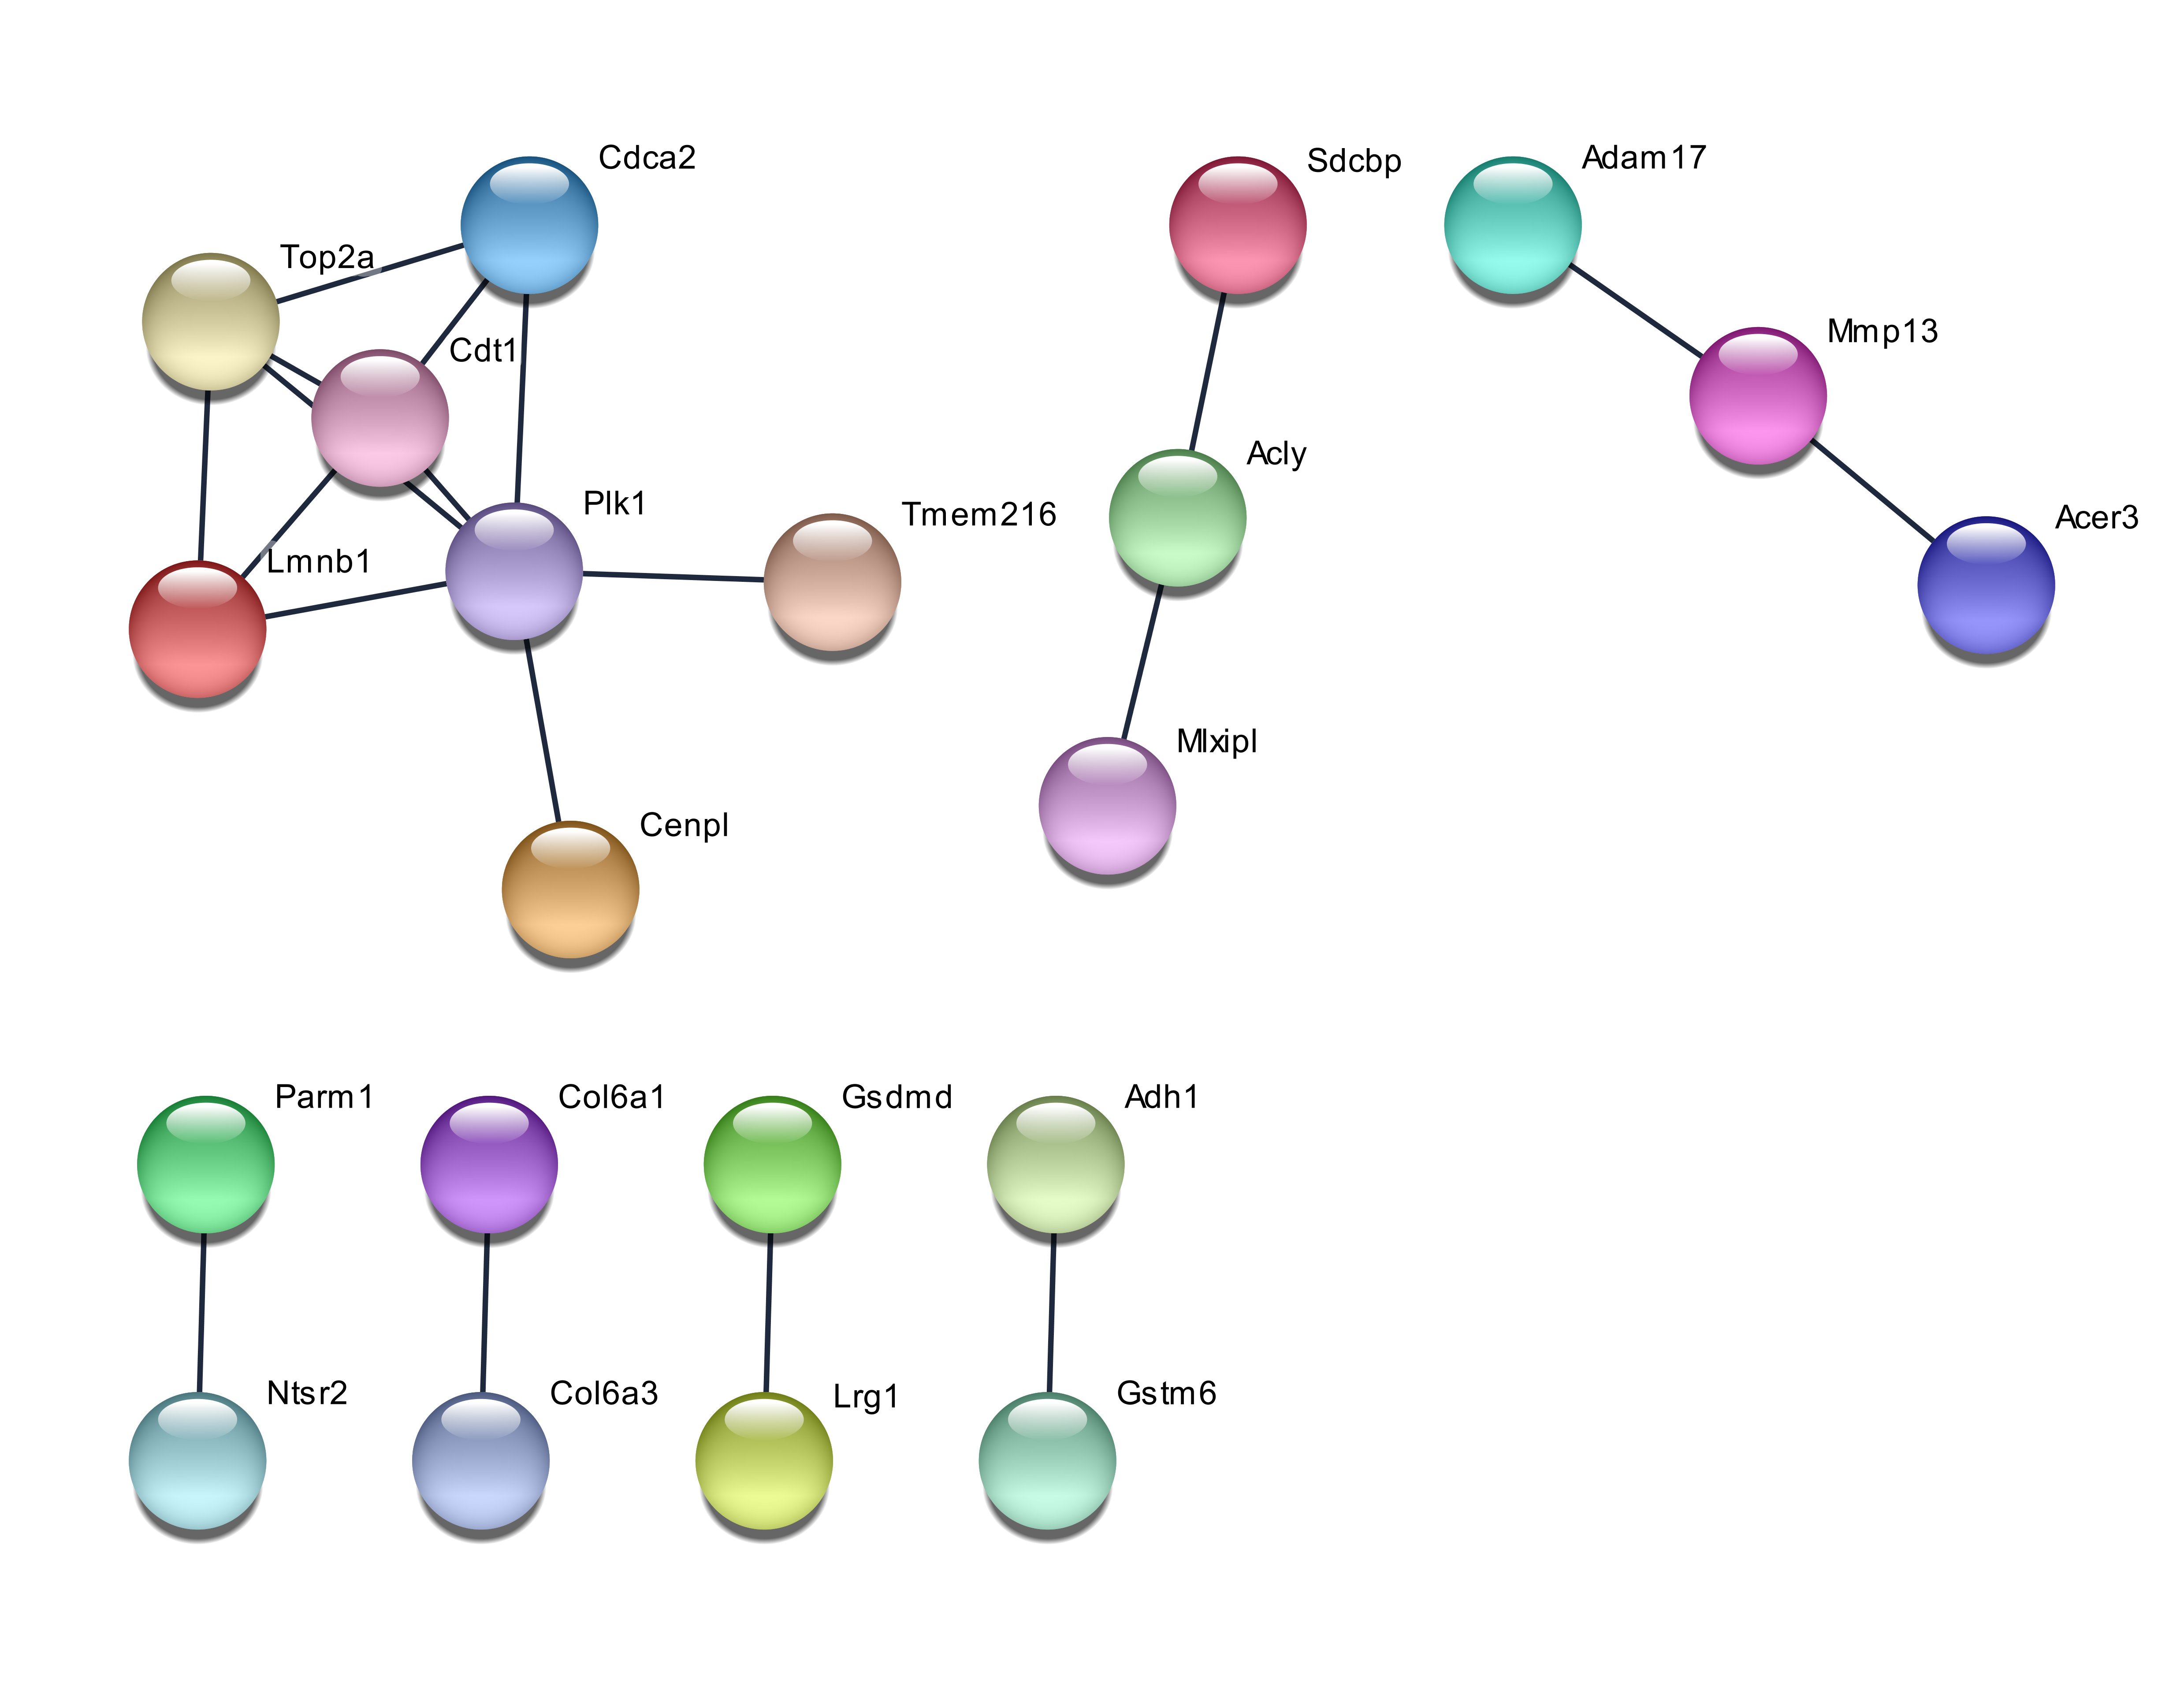
The network of protein-protein interactions showed that the 50 genes chosen by PCA exhibited a wide network, whereas the genes chosen by GA were least extensive. The interaction between genes was regarded as positive when having a combined score of ≥ 0.4. The network for the PCA chosen genes is shown in Figure 1. Among the genes chosen by PCA, two genes are considered as hub genes in the protein-protein interaction network, with Atp5a1 having nine degrees of connectivity while ApoA1 having slightly less connectivity at six degrees. The network from RF and GA chosen genes is less extensive and shown in Figure 2 and Figure 3. The biggest network consisting of seven members for RF-selected genes consisted of the hub gene Plk1 with five connections. The GA chosen genes had two networks composed of four genes, and one of them was a linear network consisting of four genes, with two of the members being Igf2r and Hsp90aa1.
Regulation of target genes by microRNA
The use of the Stringify function of Cytoscape enabled identifying similar protein-protein interactions in humans, along with the use of CyTargetLinker to predict the miRNA-gene regulatory interactions of these proteins. The genes selected by PCA which showed protein-protein interactions in humans had a total of 578 miRNA regulating the genes, with ATP5A1 and RPL18A being regulated by the greatest number of miRNAs (which was 85). The number of miRNAs regulating the genes with protein-protein interactions chosen by RF was 390, whereas for GA, the number of miRNAs was at least 356 for the 16 genes with protein interactions. One of the genes chosen by GA, HSP90AA1 was regulated by a total of 100 miRNAs.
Discussion
The use of data mining techniques combined with bioinformatics has facilitated finding biological meaning in large molecular datasets to diagnose, understand the underlying pathogenesis, and provide insight to develop treatments for various diseases. This study has compared the use of PCA, RF and GA to identify genes that differentiate adipose samples from high-fat diet treatment, compared to control, to understand the underlying biological mechanisms of obesity. The biological and molecular functions of each set of chosen genes were studied using gene annotation, pathway analysis, protein-protein interaction, and gene regulation.
There are various approaches to selecting the relevant genes. The choice of selecting the smallest number of ‘principal gene components’ that best explain the experimental data is often used for PCA, but in this study, the decision was to choose the first principal component only 17. This decision was based on the fact that the first principal component explained the more than double variance percentage compared to the second component. Based on this, the genes that had the highest loading or weightage for this component were chosen for differentiating the samples.
Moreover, it was found that choosing principal component two for selection of the important genes gave less correct classification, and the genes were less associated with GO terms associated with fat metabolism. PCA usage to select genes does not involve parameters that need to be optimized, but for GA the number of generations to be run and the number of chromosomes used can be varied. In this study, many generations were chosen such that the loads obtained for the variables show few characteristic peaks having higher values than other variables.
This study aimed to investigate the underlying mechanism regarding obesity, but if the choice were only for diagnosis, then RF alone would have sufficed. This is because RF functions as a wrapper approach where the genes selected are evaluated for accuracy of the classification at the same time. The selection of genes by RF was from using the decrease in accuracy as this has been mentioned to be better than a decrease in Gini index 18. However, it should be noted that most of the genes selected by a decrease in accuracy were also selected by Gini index, with the difference being only the selected genes' ranking. The approach of PCA is a filter method that conducts the first selection of genes, with the selected genes having to be classified with other statistical techniques. It should be noted that the three techniques of PCA, RF and GA did not include any genes among the 50 chosen genes that were associated with obesity or hypoxia (a causative risk factor), such as FTO, LEP, HIF-2, NFκB, PPAR and NPC1 3, 19, 20, 21. However, NPC2 was among the first 30 genes chosen by PCA for differentiating between a high-fat diet and normal diet treated adipose samples. Dysfunction in either NPC1 or NPC2 protein leads to an altered storage pattern of cholesterol and sphingolipids in late endosomes/lysosomes 22.
Hypoxia in humans affect the expression of MMP2 and MMP9 in adipocytes 20, and although both these genes were not among the genes selected by the three methods, the related gene Mmp13 was selected by RF. MMP13 codes for collagenase 3 in humans, which degrades the extracellular matrix 23. As Mmp13 is related to Mmp9, which is related to hypoxia, it can be noted that the combination of the different selection methods could identify different causative or related factors of a disease. The number of genes selected to be used for classification was limited to 30. The value of correct predictions was obtained by pooling six classification techniques, such as a technique that would provide bias 24, 25.
The number of genes selected for GO and the study of pathogenesis was increased to 50 as 30 genes used for classification were not enough to obtain biological meaning or provide an elaborate network of interactions. The number of genes used for gene annotation and the biological processes identified was less than that in previous publication7, but the core processes involving lipid metabolism were identified. The use of the smallest possible set of genes is advantageous in the clinical setting for diagnostic purposes and investigating disease mechanisms26, 27.
The genes picked up by using the accuracy function of RF obtained fewer GO terms, but some of them, such as lipid metabolic process, had more genes coding for important proteins (e.g. sphingomyelin phosphodiesterase 3 and acid-like 3B). Proteins closely related to both of these, such as SMPDL3A and SPMD1, have been reported to have a role in cholesterol efflux28, 29. The functional enrichment study with GA genes identified only one GO term related to extracellular exosome. The combination of the KEGG pathway and GO terms with protein-protein interaction networks suggests important genes for system-level regulation of cellular processes. The genes Vapa and Npc2 seem to be a bridge that links the hub genes ATP5a1 and Apoa1. ATP5a1 seems to link the protein cluster of Rp18a, Mrp120, Rps3a1 and Rps3, which involves the KEGG pathway of the ribosome with the pathway of acid amino degradation (mmu00280)-associated genes, such as Acadsb, Aldh6a1, and Hadhb. As the Apoa1 gene seems to be involved in cholesterol transport, efflux and homeostasis, Vapa and Npc2 can be regarded as crosstalk genes which link the above three processes. The interaction between these genes also occurs in humans, with miRNAs regulating the human genes. For instance, the human gene VAPA is regulated by 24 miRNas, whereas has-mIR-92a-3p regulates NPC2. Both these genes could be potential targets for studies of drug intervention. It has to be highlighted that although GA did not identify many protein-protein interactions, the genes identified by it have been reported to be potential targets. For example, the IGF2R-mIR-143-3p interaction has been reported to be a potential target of obesity-associated insulin resistance 30.
In the present study, the number of samples from which the data was obtained is still small, and a larger sample would have avoided the need to pool the different time points. Secondly, due to the complexity of the molecular mechanisms regulating disease development, the choice of only 50 genes for each chemometric technique made a more comprehensive evaluation of mechanism difficult for the genes chosen by RF and GA. Finally, as some of the interactions were predicted through data mining techniques, the use of in vitro or in vivo work to confirm the findings would be warranted in future studies.
Conclusion
The analysis of multivariate data in this study showed that the selection of genes for classification purpose, diagnosis, and elucidation of disease mechanisms could involve different chemometric techniques. The genes selected could be studied further using functional analyses such as GO, pathway analysis, and gene interactions to obtain an overall greater understanding. In this study, RF was better for classification purposes, whereas genes selected by PCA, such as Atp5a1, Apoa1, Vapa and Npc2, were more appropriate for showing, generally, the protein-protein interactions and, more specifically, the disease mechanisms.
Abbreviations
Acadsb: acyl-Coenzyme A dehydrogenase, short/branched chain*
Adam17: a disintegrin and metallopeptidase domain 9*
Aldh6a1: aldehyde dehydrogenase family 6, subfamily A1 *
Apoa1: apolipoprotein A-I*
Apoa2: apolipoprotein A-II*
Armcx1: armadillo repeat containing, X-linked 1*
ATP5a1: ATP synthase, H+ transporting, mitochondrial F1 complex, alpha subunit 1**
Cdt1: chromatin licensing and DNA replication factor 1*
DAVID: Database for Annotation, Visualization and Integrated Discovery
FTO: FTO alpha-ketoglutarate dependent dioxygenase*
GA: genetic algorithm
Galr3: galanin receptor 3*
Gas7: growth arrest specific 7*
GEO: Gene Expression Omnibus
GO: gene ontology
H2-Aa: histocompatibility 2, class II antigen A, alpha*
Hadhb: hydroxyacyl-Coenzyme A dehydrogenase/3-ketoacyl-Coenzyme A thiolase/enoyl-Coenzyme A hydratase (trifunctional protein), beta subunit*
HIF-2: hypoxia inducible factor 2**
Hoxa3: homeobox A3*
Igf2r: insulin-like growth factor 2 receptor*
KEGG: Kyoto Encyclopedia of Genes and Genomes
Klf4: Kruppel-like factor 4*
kNN: k-nearest neighbours
LEP: leptin**
Lilrb4a: leukocyte immunoglobulin-like receptor, subfamily B, member 4A*
miRNA: microRNA
Mlxipl: MLX interacting protein-like*
Mmp13: matrix metallopeptidase 13#
MMP2: matrix metallopeptidase 2**
MMP9: matrix metallopeptidase 9**
Mrp120: mitochondrial ribosomal protein L20#
Mup1: major urinary protein 1*
Mup2: major urinary protein 2*
Mup3: major urinary protein 3*
NFκB: nuclear factor kappa B**
NPC1: Niemann-Pick type C1**
Npc2: Niemann-Pick type C2#
PC: principal component
PCA: principal component analysis
PPAR: peroxisome proliferator activated receptor**
Rassf4: Ras association (RalGDS/AF-6) domain family member 4*
RF: random forest
Rp18a: ribosomal protein L8a#
Rps3: ribosomal protein S3#
Rps3a1: ribosomal protein S3A1#
SMPDL3A: sphingomyelin phosphodiesterase, acid-like 3A##
SPMD1: sphingomyelin phosphodiesterase 1##
STRING: Search Tool for the Retrieval of Interacting Genes
SVM: singular vector machine
Tef: thyrotroph embryonic factor*
Vapa: vesicle-associated membrane protein, associated protein A#
(*: mouse gene; **: human gene; #: mouse protein, ##: human protein)
Acknowledgement
The data analysis in this project were carried out as part of project FRGS/1/2014/SKK01/UNISZA/03/1. Dr Saravanan Dharmaraj acknowledges the financial backing of Ministry of Higher Education, Malaysia for the above research grant.
Author’s Contributions
SD performed significant contribution to the study design and conceptualization, data mining, acquisition, analysis, and interpretation of the data. MRUS checked the molecular functional aspect of the paper. NS facilitated the final drafting of the manuscript and critical revision of the content. All authors read and approved the final manuscript.
Funding
None.
Availability of data and materials
Data used in this study is from that of 15 000 genes reported in the paper of Kwon et al. with PMID:22947075 or reference 7, which is available at https://www.ncbi.nlm.nih.gov/geo/query/acc.cgi?acc=GSE39549. The processed data and algorithms for the multivariate analyses can also be obtained from corresponding author on reasonable request.
Ethics approval and consent to participate
Not applicable.
Consent for publication
Not applicable.
Competing interests
The authors declare that they have no competing interests.
References
-
Chen Y-K, Cheung C, Reuhl KR, Liu AB, Lee M-J, Lu Y-P, Yang CS. Effects of green tea polyphenol (-)-epigallocatechin-3-gallate on newly developed high-fat/Western-style diet-induced obesity and metabolic syndrome in mice. J Agric Food Chem [Internet]. 2011 Nov 9;59(21):11862-71.
.
View Article PubMed Google Scholar -
Collaborators G 2015 O. Health Effects of Overweight and Obesity in 195 Countries over 25 Years. N Engl J Med [Internet]. 2017;377(1):13-27.
.
View Article Google Scholar -
Lee M-J. Transforming growth factor beta superfamily regulation of adipose tissue biology in obesity. Biochim Biophys Acta - Mol Basis Dis [Internet]. 2018;1864(4):1160-71.
.
View Article Google Scholar -
Unamuno X, Gómez-Ambrosi J, Rodríguez A, Becerril S, Frühbeck G, Catalán V. Adipokine dysregulation and adipose tissue inflammation in human obesity. Eur J Clin Invest [Internet]. 2018 Sep;48(9):e12997.
.
View Article Google Scholar -
Rohde K, Keller M, la Cour Poulsen L, Blüher M, Kovacs P, Böttcher Y. Genetics and epigenetics in obesity. Metabolism [Internet]. 2019;92:37-50.
.
View Article Google Scholar -
McCarthy MI, Abecasis GR, Cardon LR, Goldstein DB, Little J, Ioannidis JPA, Hirschhorn JN. Genome-wide association studies for complex traits: consensus, uncertainty and challenges. Nat Rev Genet [Internet]. 2008 May;9(5):356-69.
.
View Article Google Scholar -
Kwon E-Y, Shin S-K, Cho Y-Y, et al. Time-course microarrays reveal early activation of the immune transcriptome and adipokine dysregulation leads to fibrosis in visceral adipose depots during diet-induced obesity. BMC Genomics [Internet]. 2012;13(1):450. PMID:22947075.
.
View Article Google Scholar -
Li W, Zhu W, Che J, Sun W, Liu M, Peng B, Zheng J. Microarray Profiling of Human Renal Cell Carcinoma: Identification for Potential Biomarkers and Critical Pathways. Kidney Blood Press Res [Internet]. 2013;37(4-5):506-13.
.
View Article Google Scholar -
Zhang X-M, Guo L, Chi M-H, Sun H-M, Chen X-W. Identification of active miRNA and transcription factor regulatory pathways in human obesity-related inflammation. BMC Bioinformatics [Internet]. 2015;16:76.
.
View Article PubMed Google Scholar -
Kemsley EK. A genetic algorithm (GA) approach to the calculation of canonical variates (CVs). Trends Anal Chem. 1998;17(1):24-34.
.
View Article Google Scholar -
Dharmaraj S, Gam L-Y, Sulaiman SF, Mansor SM, Ismail Z. The application of pattern recognition techniques in metabolite fingerprinting of six different Phyllanthus spp. Spectroscopy. 2011;26(1):69-78.
.
View Article Google Scholar -
Statnikov A, Wang L, Aliferis CF. A comprehensive comparison of random forests and support vector machines for microarray-based cancer classification. BMC Bioinformatics [Internet]. 2008;9(1):319.
.
View Article PubMed Google Scholar -
Amaratunga D, Cabrera J, Shkedy Z. Exploration and Analysis of DNA Microarray and Other High-Dimensional Data [Internet]. Second Edition. Hoboken, NJ, USA: John Wiley & Sons, Inc.; 2014. 1-317 p. (Wiley Series in Probability and Statistics).
.
View Article Google Scholar -
Wang L, Huang W, Zhang L, Chen Q, Zhao H. Molecular pathogenesis involved in human idiopathic pulmonary fibrosis based on an integrated microRNA‑mRNA interaction network. Mol Med Rep [Internet]. 2018 Sep 5;18(5):4365-73.
.
View Article Google Scholar -
Wang W, Liu Q, Wang Y, et al. Integration of Gene Expression Profile Data of Human Epicardial Adipose Tissue from Coronary Artery Disease to Verification of Hub Genes and Pathways. Biomed Res Int [Internet]. 2019 ;2019:1-9.
.
-
Chai Y, Tan F, Ye S, Liu F, Fan Q. Identification of core genes and prediction of miRNAs associated with osteoporosis using a bioinformatics approach. Oncol Lett [Internet]. 2018;17(1):468-81.
.
-
Yeung KY, Ruzzo WL. Principal component analysis for clustering gene expression data. Bioinformatics [Internet]. 2001 Sep 1;17(9):763-74.
.
-
Pang H, Lin A, Holford M, et al. Pathway analysis using random forests classification and regression. Bioinformatics [Internet]. 2006 Aug 15;22(16):2028-36.
.
PubMed Google Scholar -
Ursu R-I. Obesity, a Gene Review. Bull Transilv Univ Brasov Med Sci Ser VI. 2013;6(55):1-8.
.
-
Trayhurn P. Hypoxia and Adipose Tissue Function and Dysfunction in Obesity. Physiol Rev [Internet]. 2013 Jan;93(1):1-21.
.
View Article PubMed Google Scholar -
Foti DP, Brunetti A. Editorial: "Linking Hypoxia to Obesit. Front Endocrinol (Lausanne) [Internet]. 2017 Apr;8:34.
.
View Article PubMed Google Scholar -
Desnick JP, Kim J, He X, Wasserstein MP, Simonaro CM, Schuchman EH. Identification and Characterization of Eight Novel SMPD1 Mutations Causing Types A and B Niemann-Pick Disease. Mol Med [Internet]. 2010 Jul 6;16(7-8):316-21.
.
PubMed Google Scholar -
Fanjul-Fernández M, Folgueras AR, Cabrera S, López-Otín C. Matrix metalloproteinases: Evolution, gene regulation and functional analysis in mouse models. Biochim Biophys Acta - Mol Cell Res [Internet]. 2010;1803(1):3-19.
.
View Article PubMed Google Scholar -
Sharbaf FV, Mosafer S, Moattar MH. A hybrid gene selection approach for microarray data classification using cellular learning automata and ant colony optimization. Genomics [Internet]. 2016;107(6):231-8.
.
View Article PubMed Google Scholar -
Al-Rajab M, Lu J, Xu Q. Examining applying high performance genetic data feature selection and classification algorithms for colon cancer diagnosis. Comput Methods Programs Biomed [Internet]. 2017;146:11-24.
.
-
Yu H, Gu G, Liu H, Shen J, Zhao J. A Modified Ant Colony Optimization Algorithm for Tumor Marker Gene Selection. Genomics Proteomics Bioinformatics [Internet]. 2009 Dec;7(4):200-8.
.
View Article PubMed Google Scholar -
Díaz-Uriarte R, Alvarez de Andrés S. Gene selection and classification of microarray data using random forest. BMC Bioinformatics [Internet]. 2006;7:3.
.
PubMed Google Scholar -
Tamasawa N, Takayasu S, Murakami H, et al. Reduced cellular cholesterol efflux and low plasma high-density lipoprotein cholesterol in a patient with type B Niemann-Pick disease because of a novel SMPD-1 mutation. J Clin Lipidol [Internet]. 2012;6(1):74-80.
.
View Article PubMed Google Scholar -
Traini M, Quinn CM, Sandoval C, et al. Sphingomyelin Phosphodiesterase Acid-like 3A (SMPDL3A) Is a Novel Nucleotide Phosphodiesterase Regulated by Cholesterol in Human Macrophages. J Biol Chem [Internet]. 2014 Nov 21;289(47):32895-913.
.
PubMed Google Scholar -
Xihua L, Shengjie T, Weiwei G, et al. Circulating miR-143-3p inhibition protects against insulin resistance in Metabolic Syndrome via targeting of the insulin-like growth factor 2 receptor. Transl Res [Internet]. 2019;205:33-43.
.
View Article PubMed Google Scholar
Comments
Downloads
Article Details
Volume & Issue : Vol 8 No 3 (2021)
Page No.: 4277-4285
Published on: 2021-03-31
Citations
Copyrights & License
This work is licensed under a Creative Commons Attribution 4.0 International License.
Search Panel
Pubmed
Google Scholar
Pubmed
Google Scholar
Pubmed
Search for this article in:
Google Scholar
Researchgate
- HTML viewed - 3977 times
- Download PDF downloaded - 837 times
- View Article downloaded - 0 times
