

Characterization of white matter branching in human cerebella: quantitative morphological assessment and fractal analysis of skeletonized MR images
- Department of Histology, Cytology and Embryology, Kharkiv National Medical University, 4, Nauky Avenue, Kharkiv, Ukraine
Abstract
Introduction: The aim of the present study was to investigate branching characteristics of the human cerebellar white matter by the means of findings obtained from the quantitative morphological assessment and fractal analysis of the skeletonized MR images of the human cerebellum.
Methods: Thirty individuals with no apparent brain pathology (15 males and 15 females, ranging from 18 - 30 years of age) participated in this study. Their normal T2-weighted MR images of the cerebellar vermis (midsagittal plane) were examined. The skeletonizing procedure and subsequent quantitative morphological assessment of the acquired skeletonized MR images were performed. The following parameters were determined: the number of branches, the number of junctions, the amount of end-point voxels, junction voxels and slab voxels, the average and maximum branch lengths, the longest-shortest patch length, and the number of triple and quadruple points. Additionally, the individual branches of the obtained digital skeletons of the cerebellar white matter were examined and the following parameters were assessed: branch length variability, Euclidean distance, and branch length/Euclidean distance ratio. A fractal analysis was performed using the box counting method prior to and after the MR image skeletonizing procedure. The values of the fractal dimensions (FD) of both skeletonized and non-skeletonized MR images were calculated.
Results: It was established that the cerebella, which had the maximum values of the FD, possessed a large number of small branches approximately equal in length and which were connected by numerous junctions, forming numerous endpoints. Those cerebella, which had higher values of the average branch length and greater branch length variability, showed lower values of the FD. The key characteristics of the digital skeleton that determined the values of the FD of the cerebellum and its skeletonized MR images were the number of branches and the number of junctions that had the strongest correlational relationships with the FD of the skeletonized MR images. We submitted a proposition to consider the number of branches and amount of junctions as a diagnostic criterion in the determination of normal values of the FD.
Conclusions: The obtained data can be used as diagnostic criteria in assessment of the morphofunctional state of the cerebellum using magnetic resonance imaging (MRI) technique.
Introduction
Magnetic resonance imaging (MRI) technique is the most commonly neuroimaging modality used in diagnosing different organic human brain pathologies. Various morphometric tools and calculation procedures are widely employed for objective quantitative assessment of different human brain structures visualized on MR images1, 2, 3, 4. The choice of the method for quantitative assessment of human brain structures presented on MR images depends on the peculiarities of their spatial configuration.
The cerebellar white matter exhibits a sophisticated tree-like branched architecture which imparts its fractal properties5, 6. In recent years, fractal analysis has been increasingly used to assess such biological structures. The fractal dimension (FD) is a quantitative indicator of object complexity which provides a quantitative and objective estimation of the complexity degree of spatial organization and branching ratio of tree-like cerebellar structures6, 7, 8. There are different modifications of fractal analysis that require different software and image pre-processing algorithms6, 7, 8, 9, 10, 11, 12, 13.
Fractal analysis is applicable in different fields of neuroscience6, 7, 14, including neuroimaging (MRI of brain and computed tomography)15, 16, 17, 18, 19, 20, 21, 22, 23, 24, computational studies of neurons8, 23, 24, 25, 26, and fractal analysis of vascular network of brain structures27, 28, 29.
A skeletonizing technique is one of the digital image pre-processing procedures which reveals the framework of the structure — its digital skeleton12, 30, 31. The skeletonized version of the MR image of the cerebellum corresponds to the main branches of the cerebellar white matter; it is the digital framework of the cerebellar “arbor vitae”. Modern-day software programs for digital image analysis (for instance, Image J) enable the skeletonizing procedure of MR images and a subsequent quantitative morphologic assessment of the acquired digital skeletons. The quantitative analysis evaluates the main parameters of the skeletonized MR image (number of branches, number of junctions, amount of endpoint voxels and parameters of individual branches) that characterize its architecture and the degree of branching.
A combination of skeletonizing technique with quantitative analysis of the skeletonized digital images has been used to study different tree-like structures (mainly dendritic trees of neurons)32, 33, 34. In some research studies, the skeletonizing procedure has been carried out as a pre-processing method of the cerebellar MR images to obtain further FD analysis12. However, the skeletonizing procedure and quantitative analysis of digital skeletons of the cerebellar white matter have not been used before for assessment of anatomical structures on cerebellar MR images as a diagnostic algorithm.
In the present study, we implemented a combination of fractal analysis and quantitative morphological assessment of the skeletonized cerebellar MR images to quantitatively examine the branching characteristics of the human cerebellar white matter and determine the factors which specify these characteristics.
Methods
Materials
The study was conducted in compliance with the basic bioethical provisions of the Council of Europe Convention on Human Rights and Biomedicine (March 4, 1997), the Helsinki Declaration of the World Medical Association on the ethical principles of scientific medical research with human participation (1964-2008), and the order of Ministry of Health of Ukraine No. 690 (dated Sept. 23, 2009). The conclusion of the Commission on Ethics and Bioethics of Kharkiv National Medical University confirmed that the study was conducted in compliance with human rights, in accordance with the current legislation in Ukraine, met international ethical requirements and did not violate ethical standards in science and standards of biomedical research (minutes of the meeting of the commission on ethics and bioethics of KhNMU No. 10 of Nov. 7, 2018).
In this research study, T2-weighted MR images of the cerebellar vermis (midsagittal plane) were studied obtained from 30 subjects (15 males and 15 females with age range of 18-30 years) who underwent diagnostic MRI scanning of the brain at the Radiologic Center in Kharkiv, and showed no apparent brain pathology upon examination. Their MRI data were considered as relatively normal.
MRI was performed on a 1.5 T MRI machine (Siemens Magnetom Symphony, Munich, Germany). The image parameters included the following: TE (echo time) of 122 ms, TR (repetition time) of 4520 ms, and section thickness of 5 mm.
Methods
Image pre-processing
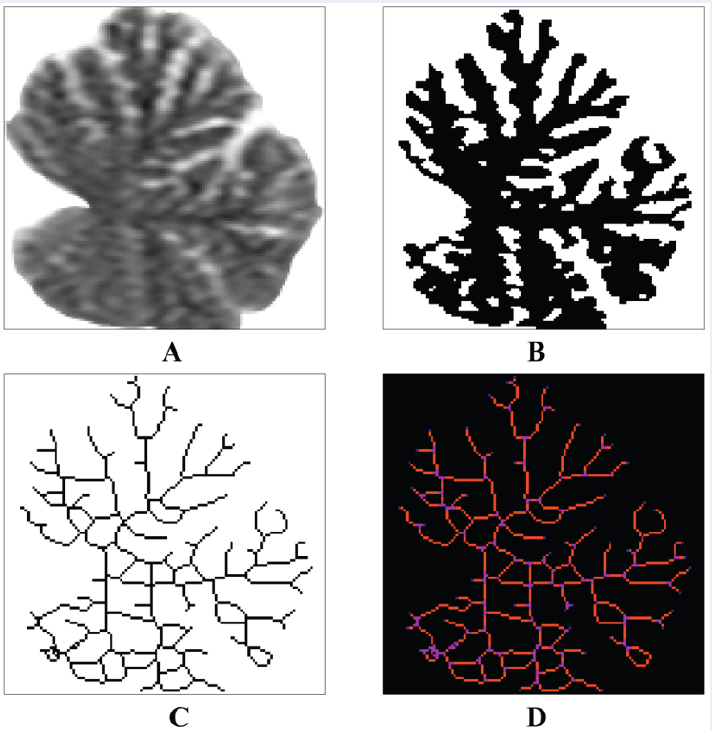
A 2 × 2-inch (128 × 128-pixels) fragments containing the midsagittal sections of the cerebella were copied from the digital MR images. Afterwards, the fragments of MR images were pre-processed with the help of Adobe Photoshop CS5 software (Adobe Inc., California, USA) for further skeletonizing procedure and fractal analysis. During this pre-processing, the structures surrounding the cerebella were initially removed from the images (Figure 1A), and the pixels in these areas were colored white (brightness value of 255). Next, the segmentation of the MR images of the cerebella into two components was performed - into the studied structures (cerebellar tissue as a whole) and the background. For that purpose, we used the “threshold” tool which converted the MR images to binary format which resulted in MR image segmentation according to the pixel brightness value. An empirical brightness threshold value of 100 was used for the localization of cerebellar tissue on MR images. As a result of the pre-processing and segmentation procedures of the MR images, the pixels corresponding to the cerebellar tissue were black (brightness value of 0) and the pixels corresponding to the background were white (brightness value of 255) (Figure 1B). Further processing and FD analysis of the binary images were performed with the Image J software.

Pre-processing and analysis of the cerebellar MR image (the midsagittal plane). A: removal of background structures; B: segmented image, cerebellar tissue was colored black, the background was colored white; C: skeletonizing procedure; D: image skeleton analysis: branches were shown in red, junctions were shown in pink, and endpoints were shown in blue.
Analysis of skeletonized MR images
The digital image skeletonizing procedure was performed using the “skeletonize” tool. This tool revealed the main branches of the cerebellar white matter and formed a linear digital skeleton of the white matter — the “arbor vitae” of the cerebellum (Figure 1C).
Furthermore, the skeletonized images were analyzed using the “analyze skeleton” tool (Figure 1D). The following parameters were estimated: the number of branches, the number of junctions, the amount of end-point voxels, junction voxels and slab voxels, the average and maximum branch lengths, the longest-shortest patch length, and the number of triple and quadruple points.
We also analyzed the individual branches of the digital skeletons of the cerebellar white matter. The following parameters were determined: branch length variability, Euclidean distance, and branch length/Euclidean distance ratio. In total, the morphologic parameters of 4130 branches of 30 cerebella were calculated.
Fractal analysis
The fractal analysis was carried out using the box counting method tool of the Image J software. The values of the two-dimensional FD were determined. The fractal analysis was performed twice: prior to and after the skeletonizing procedure. As a result, two FD were obtained: FD (100) — fractal dimension of non-skeletonized MR images (which characterized the cerebellar tissue as a whole), and FD (S) — fractal dimension of skeletonized MR images (which characterized the skeleton of the cerebellar white matter).
Statistical data processing
A statistical data processing was done using Excel 2010 software. The following values were calculated: the sample mean (M), the standard error of the mean (m), standard deviation (σ), coefficient of variation (CV, relative standard deviation), the minimum (min) and the maximum (max) values, the median (Me), and the mode (Mo). The distribution of the values by the percentiles was determined. The significance of the statistical differences between the values of FD(S) and FD(100) was assessed using Student's T test. The significance of statistical differences between the values of the quantitative parameters of different cerebellar clusters was assessed using the Mann-Whitney test. Pearson's correlation coefficient (R) was calculated to establish the relationships between the values. The significance of the correlation was assessed using Student's T test. The significance level for all results was accepted as p < 0.05.
Statistical data of the quantitative morphological assessment of the skeletonized MR images of human cerebellum
|
Parameter |
|
|
|
σ |
|
|
|
|
|
Branches |
120.03 |
4.70 |
124.50 |
25.73 |
21.44 |
3.056 |
67 |
168 |
|
Junctions |
60.60 |
2.55 |
63.50 |
13.94 |
23.00 |
3.197 |
30 |
86 |
|
End-point voxels |
40.83 |
1.50 |
40.00 |
8.24 |
20.18 |
2.759 |
28 |
58 |
|
Junction voxels |
239.10 |
10.32 |
239.50 |
56.52 |
23.64 |
3.408 |
134 |
353 |
|
Slab voxels |
734.03 |
25.94 |
747.00 |
142.09 |
19.36 |
2.428 |
405 |
973 |
|
Average branch length, m-3 |
4.02 |
0.08 |
3.98 |
0.44 |
11.00 |
1.40 |
3.19 |
5.10 |
|
Branch length variability (CV, %) |
59.31 |
1.21 |
57.14 |
6.62 |
11.16 |
0.662 |
48.89 |
77.54 |
|
Maximum branch length, m-3 |
12.97 |
0.43 |
12.95 |
2.39 |
18.42 |
2.34 |
7.93 |
16.59 |
|
Euclidean distance m-3 |
3.46 |
0.08 |
3.37 |
0.45 |
13.00 |
1.65 |
2.78 |
4.59 |
|
Branch length/Euclidean distance |
1.13 |
0.003 |
1.080 |
0.17 |
14.88 |
0.164 |
1.00 |
4.16 |
|
Longest shortest patch m-3 |
73.70 |
1.13 |
73.13 |
6.31 |
8.56 |
1.09 |
64.07 |
86.04 |
|
Triple points |
46.97 |
1.97 |
50.00 |
10.78 |
22.96 |
3.030 |
19 |
65 |
|
Quadruple points |
10.50 |
0.78 |
10.00 |
4.25 |
40.46 |
5.700 |
3 |
24 |
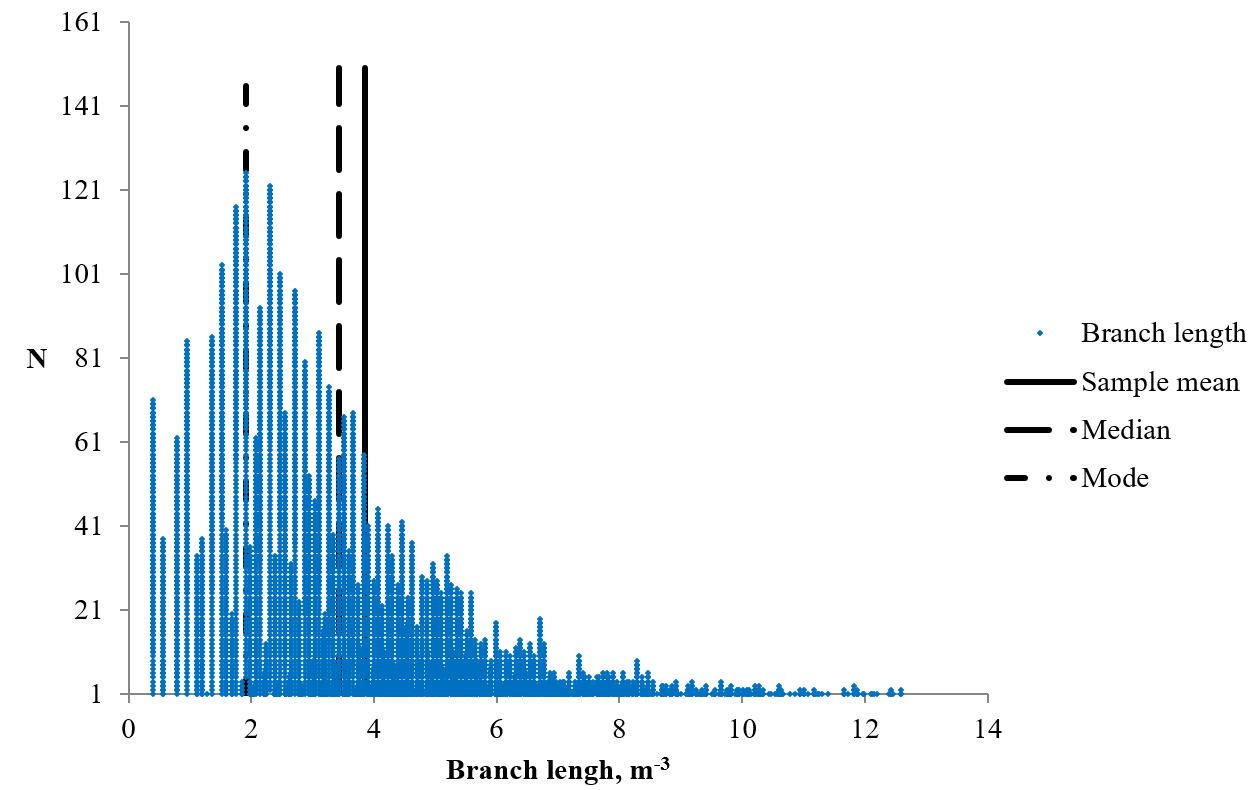
The length of the branches of skeletonized MR images of cerebellum and it’s prevalence.
Results
Quantitative characteristics of skeletonized images of human cerebella
The values of the quantitative parameters of the cerebellar white matter are presented in Table 1. Most of the parameters had mean values of the coefficient of variation; the value of quadruple points had a high coefficient of variation. The mean values of these parameters and the confidence interval of the values (calculated as M ± 2σ) may be used as norm criteria to interpret the results of the quantitative morphological assessment of the cerebellar MR skeletonized images.

Relationship between the length and Euclidean distance of the branches of skeletonized MR images of human cerebellum.
Quantitative characteristics of white matter branches of human cerebella
Morphometric parameters of 4130 branches of the skeletonized MR images of the cerebellum were estimated. The mean value of the branch length was 3.85 ± 0.04 m (min — 0.40 m, max — 16.59 m) (Figure 2). As can be seen from the data in Figure 3, the statistical distribution of the branch length had a right-hand asymmetry; the values of the sample mean (3.85 m), the mode (1.92 m) and the median (3.43 m) did not coincide. Thus, the distribution of the values by the percentiles was determined to describe the statistical distribution. The value of the percentile 2.5 was 0.56 m, percentile 16 – 1.75 m, percentile 25 – 2.25 m, percentile 50 – 3.43 m, percentile 75 – 4.98 m, percentile 84 – 5.86 m, and percentile 97.5 – 9.81 m. The mean value of the Euclidean distance of the white matter branches was 3.4 ± 0.03 m (min — 0.40 m, max — 15.33 m). The mean value of the ratio of branch length and Euclidean distance was 1.13 ± 0.003 (min — 1, max — 4.16). The branch length value was very close to the value of the Euclidean distance and often coincided with it or exceeded it by 1.1 - 1.2 times, sometimes more than 4 times. There was a significantly strong positive linear relationship between the values of branch length and Euclidean distance (R = 0.97, p ≈ 0). The distributions of these parameters are presented in Figure 3.

Quantitative characteristics of the skeletonized images of the first (1) and the second (2) clusters of cerebella.

The branch lengths (average and maximum) of the cerebella of the first (1) and the second (2) clusters.

Correlation relationships between the fractal dimension of skeletonized MR images of the cerebellum FD(S) and the quantitative parameters of the digital skeleton.

Correlation relationships between the fractal dimension of non-skeletonized MR images of the cerebellum FD(100) and the quantitative parameters of the digital skeleton.
Correlation relationships between the parameters of the skeletonized MR images of human cerebellum (Pearson's correlation coefficients (R))
|
Parameter |
1 |
2 |
3 |
4 |
5 |
6 |
7 |
8 |
9 |
10 |
11 |
12 | |
|
1 |
Branches |
- |
0.993 |
0.723 |
0.983 |
0.713 |
-0.522 |
-0.593 |
-0.441 |
-0.32 |
0.492 |
0.943 |
0.773 |
|
2 |
Junctions |
0.993 |
- |
0.643 |
0.973 |
0.753 |
-0.482 |
-0.633 |
-0.441 |
-0.26 |
0.482 |
0.963 |
0.763 |
|
3 |
End-point voxels |
0.723 |
0.643 |
- |
0.643 |
0.341 |
-0.633 |
-0.25 |
-0.462 |
-0.532 |
0.381 |
0.653 |
0.431 |
|
4 |
Junction voxels |
0.983 |
0.973 |
0.643 |
- |
0.683 |
-0.502 |
-0.573 |
-0.401 |
-0.31 |
0.472 |
0.893 |
0.803 |
|
5 |
Slab voxels |
0.713 |
0.753 |
0.341 |
0.683 |
- |
0.18 |
-0.653 |
-0.06 |
0.361 |
0.703 |
0.723 |
0.593 |
|
6 |
Average branch length, m-3 |
-0.522 |
-0.482 |
-0.633 |
-0.502 |
0.18 |
- |
0.01 |
0.552 |
0.933 |
0.18 |
-0.482 |
-0.31 |
|
7 |
Branch length variability (CV, %) |
-0.593 |
-0.633 |
-0.25 |
-0.573 |
-0.653 |
0.01 |
- |
0.431 |
-0.21 |
-0.33 |
-0.653 |
-0.421 |
|
8 |
Maximum branch length, m-3 |
-0.441 |
-0.441 |
-0.462 |
-0.401 |
-0.06 |
0.552 |
0.431 |
- |
0.441 |
0.03 |
-0.502 |
-0.19 |
|
9 |
Euclidean distance m-3 |
-0.32 |
-0.26 |
-0.532 |
-0.31 |
0.361 |
0.933 |
-0.21 |
0.441 |
- |
0.23 |
-0.25 |
-0.19 |
|
10 |
Longest shortest patch m-3 |
0.492 |
0.482 |
0.381 |
0.472 |
0.703 |
0.18 |
-0.33 |
0.03 |
0.23 |
- |
0.441 |
0.401 |
|
11 |
Triple points |
0.943 |
0.963 |
0.653 |
0.893 |
0.723 |
-0.482 |
-0.653 |
-0.502 |
-0.25 |
0.441 |
- |
0.583 |
|
12 |
Quadruple points |
0.773 |
0.763 |
0.431 |
0.803 |
0.593 |
-0.31 |
-0.421 |
-0.19 |
-0.19 |
0.401 |
0.583 |
- |
Correlational relationships of quantitative characteristics of skeletonized MR images of human cerebella
The strength and direction of the correlation relationships between the quantitative characteristics of the skeletonized MR images of human cerebella were different. As can be seen from Table 2, there were significant positive linear correlational relationships between the number of branches, the number of junctions, the amount of end-point voxels, junction voxels and slab voxels, the average and maximum branch lengths, the longest-shortest patch length, and the number of triple and quadruple points. The numbers of branches, junctions, end-point voxels, junction voxels, triple points and quadruple points had significant negative linear correlation relationships with the average branch length, the branch length variability (the coefficient of variation), and the maximum branch length.
Therefore, the more branched the white matter of the cerebellum was, the more branches, junctions and end points it had. The cerebellum with a high degree of branching of the white matter had a lot of short branches and junctions. The cerebellum with less branched white matter did not have numerous branches and junctions; their length of branches was greater and more variable than in those cerebella with greater branching degree.
Clusters of cerebella according to white matter branching features
Taking into consideration features of the branching characteristics of the digital skeletons of the cerebellar white matter, we can assume that the key characteristics of its branching pattern are the number of branches and the number of junctions. These parameters (number of branches and junctions) were related by a correlation relationship close to the functional one (R = 0.99, p = 0.11 × 10). It was easier to determine the number of branches than number of junctions (if manual count was used and image skeletonizing procedure was not applied). Thus, the number of branches was chosen as a key characteristic to divide cerebella into clusters and to determine features of other quantitative parameters in different cerebellar clusters. We divided cerebella into two clusters according to the median value of the number of branches (130). The number of branches in cerebella of the first cluster was 130 or less, and the second cluster was 131 or more. These clusters had some differences in the distribution of the values of quantitative parameters of the digital skeletons of MR images of cerebellar white matter (Figure 4, Figure 5).
The mean number of junctions in cerebella of the first cluster was 48.67 ± 2.16, and of the second cluster was 74.38 ± 2.31; the mean number of the end-point voxels was 36.40 ± 1.71 (1 cluster) and 46.38 ± 2.17 (2 cluster); the mean number of the triple points was 38.27 ± 1.94 (1 cluster) and 56.56 ± 1.50 (2 cluster); and the mean number of the quadruple points was 7.73 ± 0.62 (1 cluster) and 14.00 ± 1.23 (2 cluster).
The mean value of the average branch length in cerebella of the first cluster was 4.24 ± 0.12 m, of the second cluster — 3.86 ± 0.07 m; the mean value of the maximum branch length in cerebella of the first cluster was 13.64 ± 0.54 m, of the second cluster — 12.65 ± 0.60 m.
The differences between the values of these parameters of the cerebella of the first and second clusters were statistically significant (p < 0.05).
Fractal analysis of MR skeletonized images of cerebellum
The fractal analysis was performed to evaluate the degree of complexity of the spatial organization of the cerebellar tissue as a whole and its skeletonized MR images. The mean value of FD(100) (fractal dimension of the cerebellar tissue as a whole) was 1.738 ± 0.009 (min — 1.634, max — 1.823). The coefficient of variation of FD(100) was 3.06% which indicated a low degree of variation. The average value of FD(S) (fractal dimension of skeletonized MR images) was 1.469 ± 0.007 (min — 1.360, max — 1.551). The coefficient of variation of FD(S) was 2.76%, which also showed a low degree of variation. Both values of FD were statistically significantly different from each other (p = 0.215 × 10). There was a moderate positive linear correlation relationship between FD(100) and FD(S) (R = 0.41, p = 0.016). These values of the FD had correlation relationships of different strength and direction with the quantitative parameters of the skeletonized MR images (Figure 6, Figure 7).
As can be seen from Figure 6, FD(S) had significant positive linear correlation relationships with the number of branches (p = 0.143 × 10), the number of junctions (p = 0.644 × 10), the number of end-point voxels (p = 0.959 × 10), the number of junction voxels (p = 0.14 × 10), the number of slab voxels (p = 0.43 × 10), the longest-shortest patch length (p = 0.788 × 10), the number of triple points (p = 0.786 × 10), and the number of quadruple points (p = 0.413 × 10). FD(S) had significant negative linear correlation relationships with the average branch length (p = 0.019), the branch length variability (the coefficient of variation of branch length) (p = 0.028), the maximum branch length (p = 0.125), and the Euclidean distance (p = 0.049).
The FD of the cerebellar tissue as a whole (FD(100)) had a similar tendency to increase or decrease depending on the quantitative parameters of the skeletonized MR images but it had weaker strength of correlation relationships with these parameters than FD(S) (Figure 7). As can be seen from Figure 7, FD(100) had significant positive linear correlation relationships with the number of branches (p = 0.012), the number of junctions (p = 0.007), the number of junction voxels (p = 0.018), the number of slab voxels (p = 0.103 × 10), the longest-shortest patch length (p = 0.603 × 10), the number of triple points (p = 0.01), and the number of quadruple points (p = 0.031). FD(100) had a significant negative linear correlation relationship with the coefficient of variation of branch length (p = 0.002). However, FD(100) had no significant correlation relationships with the number of end-point voxels (p = 0.952) or maximum branch length (p = 0.997), and had significant positive linear correlation relationships with the average branch length (p = 0.012) and Euclidean distance (p = 0.603 × 10).
The mean value of FD(S) of cerebella of the first cluster (described according to the number of branches) was 1.438 ± 0.01, of the second cluster — 1.495 ± 0.01. The difference between FD(S) values of cerebella of the first and second clusters was significant (p < 0.05). The mean FD(100) value of cerebella of the first cluster was 1.720 ± 0.01, of the second cluster — 1.753 ± 0.01; however, the difference between these values was not significant (p > 0.05).
Hence, there were two groups of quantitative parameters of digital skeletons which had an impact on the values of the FD. The first group included parameters that characterized the branching of the digital skeletons (branches, junctions, junction voxels, end-point voxels, and triple and quadruple points). They were interconnected by positive correlation relationships (inside the group), had positive correlation relationships with the fractal dimensions FD(S) & FD(100), and showed negative correlation relationships with the parameters of the second group, including the average and maximum branch length, Euclidean distance, and the coefficient of variation of branch length (branch length variability, CV). The parameters of the second group exhibited negative correlation relationships with the fractal dimensions.
The cerebella, which had the maximum values of the FD, contained a larger number of small branches approximately equal in length which were connected by numerous junctions and which formed numerous endpoints. Those cerebella that had larger values of the average branch length and greater branch length variability demonstrated lower values of the FD.
It became obvious that the key characteristics of the digital skeletons that determine the values of the FD of the cerebellum and its skeletonized MR images were the number of branches and the number of junctions that showed the strongest correlation relationships with the FD of the skeletonized MR images FD(S) (Figure 7). The same parameters (the number of branches and their junctions) were used for calculation of the confidence intervals of the FD values of the skeletonized MR images of the human cerebellum.
The number of branches and their junctions remain constant throughout life, as they characterize the innate anatomical features of the white matter of the cerebellum. However, the FD of the cerebellum can change during some brain diseases10, 11, 12, 13 and may be used as an objective morphometric criterion for the diagnosis of these pathologies. Therefore, considering the fact that the FD strongly depends on the number of branches and their junctions, which have a distinct individual variability and do not change throughout life, we propose to consider these parameters for determination of the normal value of FD as a diagnostic criterion.
Discussion
In this study we aimed to determine the branching characteristics of the white matter of human cerebella through the combined use of quantitative morphological assessment and fractal analysis of the skeletonized MR images of the cerebellum. We estimated values of quantitative parameters and FD of skeletonized, as well as non-skeletonized MR images of the human cerebellum.
The main finding of the present study is that quantitative parameters of the digital skeletons of the MR images of the cerebellar white matter (e.g. branching characteristics) have an impact on the values of the cerebellar fractal dimensions. The conducted investigation has enabled us to subdivide the studied quantitative parameters into 2 groups according to their type of correlation relationship with the fractal dimension. The first group includes the number of branches, the number of junctions, the amount of junction and end-point voxels, and the number of triple and quadruple points. These parameters have positive correlation relationships with each other and exhibit positive correlation relationships with the fractal dimension. The second group of quantitative parameters includes the average and maximum branch lengths, the Euclidean distance, and the branch length variability. These parameters have negative correlation relationships with the parameters of the first group and with FD. Thus, the fractal dimension of skeletonized MR images of cerebellum increases concurrently with the numbers of branches, junctions, junction voxels, end-point voxels, and triple and quadruple points.
We conclude that the number of branches and the number of junctions exert the biggest impact on the fractal dimension. The individual differences and individual variability of FD correlates closely with these branching characteristics. Therefore, these parameters should be taken into consideration for calculation of the normal values of the FD of skeletonized MR images of the cerebellum.
We compared the FD values of cerebellum obtained in the present study with the FD values received during studies conducted by other researchers to uncover possible differences in FD values and to identify possible factors that may determine these differences. In accessible literature, we found the group of research works which involved fractal analysis of the MR images of the cerebellum10, 11, 12, 13. Two-dimensional (2D)10, 11 and three-dimensional (3D)12, 13 fractal dimensions were assessed in those studies using different modifications of fractal analysis and the values of the FD obtained in those studies differed from the data obtained in our present study.
The 2D fractal dimension values of the two-dimensional MR-images of the cerebellum were calculated using the box counting method10, 11. The MRI scans of 16 conditionally healthy persons were investigated. The mean FD value of the white matter was 1.49 ± 0.06. The study showed that patients with Chiari malformation type I had significantly reduced FD values of cerebellar white matter10, 11. This FD value was close to the FD(S) value, obtained in the present study, because skeletonizing procedure revealed the main branches of the cerebellar white matter. Thus, the FD(S) characterized the structure of the cerebellar white matter. Meanwhile, our fractal dimension of the cerebellar tissue as a whole, FD (100), exceeded the values of the fractal dimension obtained in those studies10, 11.
The values of the 3D fractal dimension of the cerebellar MR images were determined using the box counting and pixel dilation methods in the other studies12, 13. Usually, the values of the 3D fractal dimension vary from 2 to 3 and theoretically always exceed the two-dimensional FD values, which vary from 1 to 2. The values of the three-dimensional fractal dimension of the skeletonized digital images of the cerebellum were estimated in the work of Liu J.Z. et al.12. The mean value of 3D fractal dimension of the white matter was 2.26 ± 0.05 and the mean value of 3D fractal dimension of the gray matter was 2.49 ± 0.04. The pixel dilation method was used for fractal analysis. The skeletonizing procedure was used only as an image pre-processing method. In the other study13, the values of 3D fractal dimension of the cerebellum were determined using the box counting method. The T1-weighted MR images were used in the study. The mean value of 3D fractal dimension of the white matter was 2.2746 ± 0.0446 and the mean value of 3D fractal dimension of the gray matter was 2.5267 ± 0.0228. The results of that study showed that patients with multiple system atrophy of the cerebellar type presented significantly lower FD values compared to the control group13.
Thus, the values of the fractal dimension estimated by different modifications of the fractal analysis and on different types of MR images, with different algorithms of image segmentation, may be quite different. Therefore, to determine the normal values of the FD, it is important to take into account the peculiarities of the research methodology, as well as factors influencing the fractal properties of the object, since the fractal dimension is not a completely independent quantity.
The main limitations of our study are the small sample size (30 cerebellar MR images) and the small age range (18-30 years of age). Further studies with larger sample sizes and greater age range will be needed to determine the age peculiarities and the age changes of cerebellar fractal dimensions and quantitative parameters of the cerebellar white matter.
Conclusions
The present study demonstrates the main branching characteristics of the human cerebellar white matter by the use of quantitative morphological assessment and fractal dimension analysis. It can be concluded that the FD values of human cerebella depend on the branching parameters of the white matter on the cerebellar skeletonized MR images. The combined use of quantitative morphologic assessment and fractal analysis of the skeletonized MR images of the human cerebellum allows the evaluation of the spatial structural complexity and the degree of branching of the cerebellar white matter, and may be used to diagnose various diseases of the cerebellum. The obtained data can be employed as quantitative criteria in the estimation of the morphofunctional state of the human cerebellum using magnetic resonance imaging modality.
Abbreviations
2D: two-dimensional
3D: three-dimensional
FD(100): fractal dimension of non-skeletonized images
FD(S): fractal dimension of skeletonized images
FD: fractal dimension
MR images: magnetic resonance images
MRI: magnetic resonance imaging
Acknowledgments
None
Author’s contributions
All authors equally contributed to this work. All authors read and approved the final manuscript.
Funding
None
Availability of data and materials
Data and materials used and/or analyzed during the current study are available from the corresponding author on reasonable request.
Ethics approval and consent to participate
The study was conducted in compliance with the basic bioethical provisions of the Council of Europe Convention on Human Rights and Biomedicine (March 4, 1997), the Helsinki Declaration of the World Medical Association on the ethical principles of scientific medical research with human participation (1964-2008), and the order of Ministry of Health of Ukraine No. 690 dated Sept. 23, 2009. The conclusion of the Commission on Ethics and Bioethics of Kharkiv National Medical University confirmed that the study was conducted in compliance with human rights, in accordance with the current legislation in Ukraine, met international ethical requirements and did not violate ethical standards in science and standards of biomedical research (minutes of the meeting of the commission on ethics and bioethics of KhNMU No. 10 of Nov. 7, 2018). All participants provided written informed consent.
Consent for publication
Not applicable.
Competing interests
The authors declare that they have no competing interests.