

Copyrights: Nadukkandy Prajitha, Parayanthala Valappil Mohanan, 2021. License: 
This work is licensed under a Creative Commons Attribution 4.0 International License.
Abstract
Introduction: Bacterial toxins are considered to be obscuring factors in multiple human diseases. Accidental contamination by bacterial lipopolysaccharides (LPS) and lipoteichoic acid (LTA) in biomedical and biotechnological products may lead to inflammation and associated pyrogenic reactions in humans. LPS are the most studied and clinically important pyrogen from gram-negative bacteria, while LTA is derived from the cell wall of gram-positive bacteria. Previous studies have identified that LPS and LTA induce a pyrogenic response in living systems. However, the detailed mechanisms of cellular toxicity have not yet been determined. The present study aimed to investigate LPS-induced and LTA-induced immune response activation and the ensuing effects on cellular integrity and organelle function in monocytes and monocyte-derived macrophages.
Methods: With monocytes and macrophages being the first lines of defense against pathogenic invasion, THP-1 cells were selected as an in vitro model for the present study. THP-1 is a cancerous monocyte cell line and can differentiate into macrophages via stimulation with phorbolmyristic acid. Intracellular responses of monocytes and monocyte-derived macrophages following exposure to LPS and LTA were analyzed through several assays, including MTT, Neutral red, DCFH-DA, NO release, DilCI (5), Annexin V-PI FACS, Rhodamine phalloidine, Acridine Orange, and JC1. The expression of the inflammation-related genes NFκB, COX2, IL-1β, and TNF-α, along with activation of inflammatory signaling, was also assessed in monocytes following toxic interaction.
Results & Conclusion: The results revealed that LPS and LTA can induce inflammatory signals at nanogram concentrations but are non-cytotoxic at low concentrations. LPS exposure had no significant toxic impacts on membrane integrity and organelle function. LPS induced neither apoptotic nor necrotic cell death of THP-1 cells at the selected concentration. However, LTA caused cell membrane damage and organelle dysfunction in a time and dose-dependent manner. LTA exposure led to oxidative stress and apoptotic cell death mediated by reactive oxygen species (ROS) and reactive nitrogen species (RNS). Both bacterial toxins augmented the expression of inflammatory genes and associated inflammatory signal transmission in THP-1 cells. The overall cellular effect was dependent on dose and time of exposure.
Introduction
Biomaterials, medical devices, injectables, and pharmaceuticals intended for use on living subjects should be non-toxic and biocompatible. Contamination of medical products or devices with a chemical or biological agent is a major challenge faced by clinicians and pharmaceutical manufacturers. All medical products should be free from toxic contamination and biological risks, such as inflammatory responses, fever, and febrile reactions, that are associated with their use on living subjects. Screening of medical products for pyrogens is a mandatory regulatory requirement. Pyrogens induce fever or febrile reactions in humans and animals. The term pyrogen is derived from the Greek word “pyr,” meaning fever. Fever and febrile reactions are represented by an elevated body temperature above the normal physiological range (36.5°C–37.5°C). Under normal circumstances, fever and febrile reactions are beneficial for hosts to fight against infection or injury. However, chronic immune activation associated with fever will result in cellular toxicity, hyper-activation of cytokines, and systemic inflammation. Pyrogenic fever is the most common adverse effect reported following the administration of contaminated pharmaceuticals1, implanted devices, and biotechnological products2. Pyrexia is the term commonly used to denote pyrogen-mediated fever. Complications associated with pyrexia depend on the type and complexity of the associated pyrogens, the immunity of an affected individual, and genotypic and phenotypic differences in heat tolerance of an individual. Hyperthermic reactions may lead to heatstroke, multiple organ failure, or, in extreme cases, death3.
Most biotechnological products intended for clinical applications are based on recombinant proteins, antibodies, or plasmids synthesized or isolated from bacterial species, particularly Escherichia coli (E. coli). Therefore, these preparations involve some risk of bacterial contamination. Introduction of bacterial cell components (pyrogenic contamination) may result in inflammation and toxic shock. External antigens such as bacteria, viruses, fungi, chemicals, and leachates on medical devices act as exogenous pyrogens. Bacterial lipopolysaccharides (LPS) are the most potent and harmful exogenous pyrogens. LPS are endotoxins that originate from the cell walls of gram-negative bacteria.
Lipoteichoic acid (LTA) is a non-endotoxin pyrogen originating from gram-positive bacteria that plays a crucial role in initiating fever reactions. In every organism, the internal homeostatic mechanism is maintained by coordinating various physiological and biochemical processes. In humans, the pre-optic area of the anterior hypothalamus (POA) acts as the principal thermoregulatory center of the brain. Thermoreceptors in the hypothalamus receive signals related to temperature fluctuation in the internal environment, whereas skin thermoreceptors receive signals from the external environment. Synchronized action of the central nervous system (CNS) and endocrine hormones sustains the body’s temperature in a narrow physiological range4.
Immuno-toxic response against most pyrogens begins with the release of inflammatory cytokines. Pyrogen-induced variation of body temperature is achieved through cytokine signaling and the release of eicosanoid mediators in the CNS. Eicosanoids are signaling molecules produced by the oxidation of polyunsaturated fatty acids, such as arachidonic acid. The eicosanoid prostaglandin (PG) E2 (PGE2) plays a central role in the elevation of body temperature during a pyrogenic attack. PG H/G synthase or cyclooxygenase (COX) act as the myeloperoxidase that catalyzes the rate-limiting step of PG synthesis from arachidonic acid. There are two isoforms of COX, COX1, and COX2. COX2 is regulated by growth factors, interleukin-1beta (IL1-β), interleukin-6 (IL-6), and tumor necrosis factor-alpha (TNF-α), and is consequently overexpressed during inflammation. COX2 mediates the production of PGE2, PGD2, PGI2, and thromboxane A2, with PGE2 exerting significant effects on the CNS5. Following administration of LPS, elevated expression of COX2 mRNA has been reported in various areas of rat brains, including in the leptomeninges, neocortex, cingulate cortex, piriform cortex, hippocampus, lateral amygdala, thalamus, hypothalamus, striatum, preoptic area, blood vessels, perivascular monocytes, and endothelial cells6, 7.
The human immune system involves a wide network of organs and cells that defend against a large range of foreign invaders, injuries, and infections. Immune cells that play significant roles in pathogen defense include monocytes, macrophages, and dendritic cells. In mammals, circulating monocytes protect against bacterial toxins. THP-1 cells are considered a suitable model for immuno-toxicity studies as they possess the structural and functional characteristics of human monocytes. Recently, Długosz et al. (2019) reported that cytokine signaling via THP-1 monocytes follows infection with the parasite Toxocara canis and its glycans. To prove the possible route of the immune response against parasitic infection, they used THP-1 cells as the cell model8. Phorbol 12-myristate 13-acetate (PMA) mediated differentiation of THP-1 monocytes is a well-established technique to analyze the in vitro response of macrophages to various toxins, including pandemic viral agents9. The present study focused on the in-depth mechanism of the cellular and immunological responses of THP-1 cells when exposed to LPS and LTA.
Methods
Cell culture and passage
THP-1 cells were purchased from National Centre for Cell Science, Pune, India. THP-1 is a cancerous monocytic non-adhering cell maintained in RPMI-1640 medium modified to contain 2 mM L-glutamine, 10 mM HEPES, 1 mM sodium pyruvate, 4500 mg/L glucose, 1500 mg/L sodium bicarbonate, and 10% fetal bovine serum. Cells were sub-cultured into a new tissue culture flask when the concentration reached 8 x 10⁵ cells/mL. A new vial of cells was revived and maintained for the study after every five passages. THP-1 cells possess large, round, single-shaped morphology with a diameter of 18 µm to 21 µm.
Monocyte-macrophage differentiation
THP-1 monocytes were treated with PMA to activate their differentiation into macrophages, known as monocyte-derived macrophages (MDMs). Phase-contrast images of the cells were taken under a compound microscope (Leica, Japan) to analyze the difference in morphological characteristics of monocytes and MDMs.
Cytotoxicity Analysis
Giemsa staining
The microscopic nuclear stain Giemsa was used to analyze the morphological characteristics of MDM cells following treatment with LPS and LTA. The Giemsa stain is commonly used to stain blood cells. The Giemsa stain stains the nucleus deep purple, while the cytoplasm appears pink. For staining purposes, 1 x 10⁵ cells/mL were seeded over sterile coverslips placed in a 6-well plate. The cells, along with PMA, were incubated at 37°C with 5% CO2 for 24 hours. After incubation, the cells were exposed to set concentrations of LPS (0.25, 1, and 5 EU/mL) and LTA (0.1, 10, and 1000 µg/mL) for 24 hours. The next day, cells were washed three times with sterile phosphate buffered saline (PBS) and fixed using 4% formaldehyde for 15 minutes. The cells were washed again with PBS to remove excess fixative. After fixation, the cells were stained with 10% Giemsa for 5 minutes, then washed three times with PBS. Morphologic analysis was done using a compound microscope under 40x magnification (Leica, Japan).
Rhodamine phalloidin staining
Morphological integrity of the cells was maintained by actin, a highly organized structural protein that provides mechanical strength to the cell cytoskeleton. Rhodamine phalloidine is a conjugate of the non-fluorescent F-actin-binding protein, phalloidin, and the red fluorescent compound, tetramethylrhodamine. The stain shows an excitation/emission wavelength of 540 nm–565 nm. Thus, rhodamine phalloidine stains the actin filament with red fluorescence. For the assay, cells were taken at a density of 1 x 10⁵ cells/mL, seeded over a coverslip placed in a 6-well plate, and incubated overnight for attachment. After 24 hours of incubation, the cells were exposed to set concentrations of LPS (0.25, 0.5, 1, 2, and 5 EU/mL) and LTA (0.1, 1, 10, 100, and 1000 µg/mL). Cells were further incubated at 37°C with 5% CO2 for 24 hours. The following day, the cells were washed with PBS and fixed using 4% formaldehyde for 10 minutes. Excess aldehyde was quenched using 0.1 M glycine in PBS for 5 minutes. To permeabilize the cell membranes, 0.1% Triton-X 100 (in PBS) was added. Permeabilized cells were incubated with rhodamine-phalloidin (1:250 dilutions in PBS) for 15 minutes at room temperature. The nucleus was counterstained with the blue fluorescent dye DAPI. Cells were thoroughly washed with sterile PBS and were imaged under blue (461 nm) and red (620 nm) fluorescence microscope filters (Axio Scope.A1, Carl Zeiss, Germany).
MTT assay
The functional integrity of mitochondria is necessary for maintaining the viability of living cells, and 3-(4, 5-dimethylthiazol-2-yl)-2,5-diphenyltetrazolium bromide (MTT) is widely used to assess cell’s mitochondrial reduction potential, and therefore their viability. This method utilizes the principle of MTT oxidizing and reducing to an insoluble purple-colored product, known as formazan. The intensity of the purple color formed is directly proportional to the number of active mitochondria in cells. For the assay, cells were seeded into a 96-well plate at a density of 1 x 10⁴ cells/mL and incubated at 37°C with 5% CO2 for 24h. After incubation, the cells were treated with set concentrations of LPS (0.25, 0.5, 1, 2, and 5 EU/mL) and LTA (0.1, 1, 10, 100, and 1000 µg/mL). Cells were exposed to the toxicants for 24 hours, 48 hours, and 72 hours at 37°C with 5% CO2. After incubation, the supernatant was removed, and 0.05 mg/mL of MTT dye was added to each well. The plate was incubated for 3 hours in the dark. Following incubation, the cells were washed with PBS, and 100 μL DMSO was added to each well. The plate was again incubated in the dark for 30 minutes at room temperature. The optical density of the purple color was measured at 540 nm using ELx808 multiwell plate reader (BioTek Instruments, USA). A graph was plotted as the percentage of mitochondrial activity in treated cells compared to the untreated control.
Neutral red uptake (NRU) assay
Lysosomes are phagocytic vesicles present inside the cells. Phagocytosis of neutral red dye by healthy lysosomes indicates their functional integrity. Cellular viability following LPS and LTA treatment was analyzed as a function of lysosomal activity. Cells at a density of 1 x 10⁴ cells/mL were cultured in a 96-well plate and incubated at 37°C with 5% CO2 for 24 hours. After incubation, the cells were exposed to concentrations of LPS (0.25, 0.5, 1, 2, and 5 EU/mL) and LTA (0.1, 1, 10, 100, and 1000 µg/mL) for 24 hours, 48 hours, or 72 hours. The following day, the supernatant was removed from each well, and 10 μL of 1% neutral red dye was added. The cells were then incubated in the dark for 3 hours. Following incubation, the cells were washed with PBS, and the dye was solubilized using 100 μL acid alcohol (1% [v/v] acetic acid and 50% ethanol). Cells were agitated in a shaker incubator for 30 minutes at 60 rpm. Absorbance was measured at 540 nm using an ELx808 multiwell plate reader (BioTek Instruments, USA).
2′7′-Dichlorofluorescein diacetate assay
The fluorescent probe 2′7′-dichlorofluorescein diacetate (DCFH-DA) is used as an indicator of reactive oxygen species (ROS) generation within cells. The non-fluorescing DCFH-DA dye is freely permeable through the cell membrane and undergoes deacetylation by intracellular esterase enzymes. The deacetylated 2′,7′-dichlorofluorescein (DCFH) oxidizes to form a highly fluorescent green compound dichlorofluorescein (DCF) by the action of ROS generated inside the cells. Here, the presence of ROS inside the cells following LPS and LTA exposure for a period of 1 hour, 3 hours, 24 hours, 48 hours, and 72 hours was analyzed using DCFH-DA. Cells at a density of 1 x 10⁴ cells/mL seeded in a 96-well plate were allowed to attach overnight. Cells were exposed to concentrations of LPS (0.25, 0.5, 1, 2, and 5 EU/mL) and LTA (0.1, 1, 10, 100, and 1000 µg/mL) and incubated at 37°C with 5% CO2 and 5 μM DCFH-DA for the required period of time. After incubation, the supernatant medium was replaced with PBS. Fluorescence intensity was measured using the Infinite F Nano+ and the Tecan fluorescence plate reader at an excitation and emission wavelength of 485 nm and 530 nm, respectively.
Griess reagent assay
The production of reactive nitrogen species (RNS) was analyzed using a modified Griess assay. Naphthyl ethylenediamine dihydrochloride and sulphanilamide, which are present in the Griess reagent, react with nitrite released from cells to form a purple azo product. The absorbance of the product formed is directly proportional to the number of RNS generated inside the cells. A 96-well plate was seeded with cells at a density of 1 x 10⁴ cells/mL and incubated at 37°C with 5% CO2 overnight. The following day, after removing the supernatant medium, the cells were treated with LPS (0.25, 0.5,1, 2, and 5 EU/mL) and LTA (0.1, 1, 10, 100 and 1000 µg/mL) for 24 hours, 48 hours, or 72 hours. After incubation, 50 μL of supernatant was taken from each well and mixed with an equal volume of Griess reagent. The mixture was allowed to stand at room temperature for 10 minutes. Absorbance was measured at 540 nm using a multiwell plate reader (BioTek, USA). The concentration of nitrite released in the supernatant of treated cells was calculated using a standard graph plotted using sodium nitrite as a substrate because nitrite (NO2–), is one of two primary, stable and nonvolatile breakdown products of NO.
Acridine orange (AO) fluorescent staining
Lysosomes are known as the suicide bags of living cells. Destabilization of the lysosomal membrane causes the release of vesicular hydrolytic enzymes into the cytosol. AO is a DNA intercalating agent and a cationic fluorochrome that diffuses through the cell membrane. The fluorescence emitted by AO depends on the pH of the medium. At an acidic pH, the dye becomes protonated and emits an orange-red fluorescence, whereas, at an alkaline pH, it remains green in color. Therefore, healthy lysosomes emit red fluorescence after staining with AO. For the assay, 5 x 10⁴ cells/mL were seeded in a 6-well plate containing sterile coverslips. Cells were incubated for 24 hours to allow attachment to the coverslip. After incubation, the cells were treated with LPS (0.25, 0.5, 1, 2, and 5 EU/mL) and LTA (0.1, 1, 10, 100m and 1000 µg/mL) for 24 hours. The following day, live cells were stained with 1 mL of AO solution (2 μg/mL in PBS) for 20 minutes at 37°C. For qualitative analysis of the lysosomes, an image was taken under green and red fluorescent microscope filters (Axio scope A1, Carl Zeiss).
DilCI (5) fluorescence-activated cell sorting (FACS) analysis
Analysis of mitochondrial membrane potential (MMP) following exposure to LPS and LTA was carried out using the MitoProbe™ DiIC1 (5) Assay Kit. The kit provides red fluorescent cyanine dye DiIC1 (5) (1,1′,3,3,3′,3′-hexamethylindodicarbo-cyanine iodide) and an MMP distracting compound, carbonyl cyanide 3-chlorophenylhydrazone (CCCP). DiICI (5) dye specifically stains active mitochondria. Therefore, a decrease in the intensity of DiICI (5) fluorescence indicates a decrease in the number of healthy mitochondria inside cells. Cells at a density of 1 x 10⁶ cells/mL were seeded in a 6-well plate and incubated at 37°C with 5% CO2 for 24 hours. The cells were treated with selected concentrations of LPS (1, 2, and 5 EU/mL) and LTA (10, 100, and 1000 µg/mL) for 24 hours. The following day, the cells were harvested and centrifuged at 1200 rpm for 3 minutes. Cell pellets were washed three times with sterile PBS. After washing, the cells were stained with a 0.5 µM concentration of DilCI (5) for 30 minutes at 37°C. The positive control had 1 µL CCCP added. After incubation, cells were washed with PBS, and FACS analysis was done under an excitation/emission filter of 638nm to 658nm using a Beckman Coulter flow cytometer.
Fluorescence imaging by JC1 probe
Mitochondrial membrane potential was also analyzed with a fluorescent carbocyanine probe, JC1 (5,5′,6,6′-tetrachloro-1,1′,3,3′-tetraethylbenzimi-dazolylcarbocyanine iodide). Mitochondria that possess a specified range of membrane potential emit red fluorescence after JC1 staining. JC1 is a lipophilic dye that enters the mitochondria and polymerizes to form J-aggregates, which, in turn, emit red fluorescence. JC1 emits green fluorescence in the cytoplasm, where it exists as a J-monomer. Cells were seeded at a density of 5 x 10⁴ cells/mL over sterile coverslips placed in a 6-well plate. The confluent culture was then exposed to concentrations of LPS (0.25, 1, and 5 EU/mL) and LTA (0.1, 10, and 1000 µg/mL) for 24 hours. Following exposure, cells were stained with 1 μM JC-1 dye at room temperature for 20 minutes. After staining, cells were washed three times with sterile PBS to remove excess dye. JC1-stained mitochondria were observed under a fluorescence microscope (Axio Scope.A1, Carl Zeiss, Germany) using green and red filters.
Lactate dehydrogenase (LDH) release assay
LDH is a cytosolic enzyme involved in the carbohydrate metabolism of almost all cells in the human body. Any destruction of the plasma membrane results in will the release of LDH from inside the cells into the extracellular medium. In this assay, the release of LDH into the extracellular medium following exposure to LPS and LTA was analyzed using a commercially available detection kit (CyQUANT™, Thermofisher Scientific). The analysis is based on the principle that LDH catalyzes the conversion of lactate to pyruvate via the reduction of NAD+ to NADH. Diaphorase enzymes use this NADH to reduce tetrazolium salt (INT) into a red-colored formazan product measurable at 490 nm. The concentration of formazan increases with an increase in the concentration of LDH released into the extracellular medium. For the assay, 1 x 10⁴ cells/mL were seeded into a 96-well plate and incubated overnight. Cells were then treated with LPS (0.25, 0.5, 1, 2, and 5 EU/mL) and LTA (0.1, 1, 10, 100, and 1000 µg/mL) for 24 hours, 48 hours, and 72 hours. After incubation, the cell culture supernatant was aspirated from each well, and LDH release was analyzed per the manufacturer’s instructions.
Live-dead assay by calcein-AM and propidium iodide
The combination of calcein-AM and propidium iodide (PI) stains was used to assess the percentage of live and dead cell populations in cultures following exposure to LPS and LTA. Calcein-AM is permeable through the cell membrane, and it forms a polyanionic fluorescein derivative following hydrolysis by intracellular esterase enzymes. Calcein-AM-stained cells emit green fluorescence and are considered to be viable. PI is a nucleophilic dye that stains the nuclei of dead cells. PI can penetrate the cells with compromised plasma membranes and emit red fluorescence. In this assay, cells were seeded at a density of 1 x 10⁶ cells/mL over sterile coverslips placed in a 6-well plate. The plate was incubated at 37°C for 24 hours. The medium was removed the following day, and the cells were treated with concentrations of LPS (0.25, 0.5, 1, 2, and 5 EU/mL) and LTA (0.1, 1, 10, 100, and 1000 µg/mL) for 24 hours, 48 hours, and 72 hours. The supernatant medium was discarded, and the cells were washed with sterile PBS. Calcein-AM (1 μg/mL) was added to the wells, which were then incubated at 37°C for 40 minutes. The cells were then treated with PI (2.5 μM) for 5 minutes. After staining, the cells were washed with PBS and observed under green and red fluorescence microscope filters (Axio Scope.A1, Carl Zeiss, Germany). Quantitative analysis was carried out by seeding cells in a 96-well plate at a density of 1 x 10⁴ cells/mL. The same staining procedure as described above was carried out. Fluorescence was measured with a fluorescent microplate reader (Infinite F Nano+, Tecan) using an excitation/emission filter of 485 nm to 595 nm.
Apoptosis by annexin V/PI staining
Annexin V/PI dual stains are widely used to detect the apoptotic and necrotic stages of cell death following exposure to test chemicals or compounds. Annexin V selectively interacts with phosphatidylserine (PS), which is located at the inner surface of the cell plasma membrane. During apoptosis, PS flips from the intracellular surface of the plasma membrane to the outer surface. This flipping enables annexin V to interact with PS. Therefore, annexin V only interacts with PS in apoptotic cells, emitting green fluorescence. PI stains the nuclei of dead or necrotic cells. Therefore, cells undergoing necrotic death emit red fluorescence. In the present study, this stain was carried out using a commercially available assay kit, with the manufacturer’s instructions followed. Cells at a density5 of 1 x 10⁶ cells/mL were seeded in a 6-well plate and incubated at 37°C with 5% CO2 for 24 hours. After incubation, cells were exposed to LPS (0.25, 0.5, 1, 2, and 5 EU/mL) and LTA (0.1, 1, 10, 100, and 1000 µg/mL) for 24 hours. The following day, the cells were harvested by trypsinization and centrifuged at 1200 rpm for 5 minutes. The cell pellets were washed three times with cold PBS. After washing, the cells were stained with 5 μL of annexin V in a 1X annexin binding buffer (ABB) for 10 minutes. Five minutes before the analysis, 1 μL of PI (100 μg/L) was added to each tube. The samples were kept on ice and immediately analyzed using an image flow cytometer (Amnis®, FlowSight®) under fluorescence emissions of 530 nm and 575 nm. Gating was done using specified controls: cells with annexin V only, cells without annexin or PI, and cells with PI only.
Analysis of Immunological response
Cytokine gene expression using quantitative real-time PCR
Quantitative real-time polymerase chain reactions (qRT-PCR) were performed to analyze the expression of cytokine genes in MDM cells following 24 hours of exposure to LPS (1, 2, and 5 EU/mL) and LTA (10, 100, and 1000 µg/mL). RNA was isolated from treated and untreated cells using RNeasy Mini Kit as per the manufacturer’s instructions. The concentration of RNA was estimated with a BioPhotometer (Eppendorf). RNA isolated from untreated controls and treated samples were kept frozen at -20°C until use. First-strand complementary DNA (cDNA) was reverse transcribed from 200 ng of total RNA using the reverse transcriptase core kit. Expressions of IL-1β, TNF-α, nuclear factor-kappa b (NFκB), and COX2 were analyzed using the Bio-Rad PCR system. PCRs were performed using the following amplification program, initial denaturation at 95°C for 1 minute, 35 cycles of 3 seconds of denaturation at 95°C, 30 seconds annealing at 51°C – 62°C, and 15-second extensions at 72°C. The program was terminated following 10 minutes at 72°C. The reference gene β-actin (ACTB) was used to normalize the gene expression data. Amplification of genes and data analysis were carried out using system software. Primer sequences used for the PCR reactions are given in Table 1.
| S.No | Genes | Primer Sequences |
|---|---|---|
| 1 | IL-1beta | FP: 5’-ATAAGCCCACTCTACAGCT-3’ RP: 5’-ATTGGCCCTGAAAGGAGAGA-3’ |
| 2 | TNF-α | FP: 5’-CAGAGGGAAGAGTTCCCCAG-3’ RP: 5’-CCTTGGTCTGGTAGGAGACG-3’ |
| 3 | NFκB | FP: 5’-CGCCGCTTAGGAGGGAGA-3’ RP: 5’-AGGTATGGGCCATCTGCTGT-3’ |
| 4 | COX2 | FP: 5’-TCATCAACACTGCCTCAATTC-3’ RP: 5’-CTCTGGATCTGGAACACTGA-3’ |
| 5 | β-actin | FP: 5’-AACTACCTTCAACTCCATCA-3’ RP: 5’-GAGCAATGATCTTGATCTTCA-3’ |
Immunocytochemistry analysis of NFкB p65
Nuclear translocation of activated NFкB p65 in MDM cells following LPS exposure was analyzed using a fluorescence microscope. For fluorescence imaging, 1 x 10⁵ cells/mL were seeded over a coverslip placed in a single-well dish. Specific concentrations of LPS (0.25, 0.5, 1, 2, and 5 EU/mL) were added to corresponding wells and incubated for 24 hours. After LPS exposure, the cells were washed with PBS and fixed with 4% formaldehyde for 5 minutes. Cells were then washed again with PBS and permeabilized with Triton X100. Blocking of unwanted sites was done using 1% bovine serum albumin (BSA). Cells were then washed three times with PBS and incubated overnight with an anti-NFкB p65 primary antibody (1:500 dilution) at 4°C. After incubation, the cells were washed another three times with PBS. Fluorescin isothiocyanate-tagged (FITC-tagged) secondary antibodies (1:500 dilution) were added, and the cells were then kept at room temperature for 2 hours. Cells were then washed with PBS, and the imaging was done under a fluorescence microscope (Axio Scope). Actin filaments and the nuclei of the cells were counterstained with rhodamine phalloidine and DAPI, respectively.
Analysis of NFкB p65 activation by flow cytometry
Activation of the NFкB pathway in MDM cells following exposure to selected concentrations of LPS and LTA was analyzed using an image flow cytometer. For the analysis, cells at a density of 1 x 10⁶ cells/mL were seeded in a 6-well plate and incubated at 37°C with 5% CO2 for 24 hours. The following day, cells were treated with LPS (0.25, 1, and 5 EU/mL) and LTA (0.1, 10, and 1000 µg/mL), for 24 hours. Untreated cells served as the negative control. Treated and untreated cells were harvested from the wells and centrifuged at 1200 rpm for 3 minutes. Cell pellets were washed with sterile PBS. After washing, the cells were fixed with 80% ethanol for 5 minutes. Permeabilzation was done using 0.1% Triton X100. After permeabilization, the cells were washed three times with PBS and incubated with an anti-NFкB p65 primary antibody (1:1000 dilution) overnight at 4°C. Cells were washed again with sterile PBS and stained with the FITC-tagged secondary antibody. After incubation at room temperature for 2 hours, the cells were analyzed for NFкB activation using a green laser.
COX2 activation by flow cytometry
Pyrogenic response following exposure to LPS and LTA involves the release of PGs through the activation of the COX2 enzyme pathways. For the analysis, 1 x 10⁶ cells/mL were seeded in a 6-well plate and incubated at 37°C with 5% CO2. The cells were treated with LPS (0.25, 1, and 5 EU/mL) and LTA (0.1, 10, and 1000 µg/mL) for 24 hours. Untreated cells served as the negative control. Treated and untreated cells were then centrifuged at 1200 rpm for 3 minutes, after which the pellets were washed three times with sterile PBS. After fixation with 80% ethanol, cells were permeabilized with 0.1% Triton X100 for 1 minute. Following an additional PBS wash, the cells were incubated with anti-COX2 primary antibody (1:1000 dilution) at 4°C for 24 hours. After incubation with the primary antibody, the cells were stained with the FITC-tagged secondary antibody. After incubation in the dark at room temperature for 2 hours, FACS analysis was carried out using a green laser.
Statistical analysis
The experiment was done in triplicates. The results of the MTT assay, neutral red uptake assay, ROS production assay, nitrile radical release assay, LDH assay, calcein-AM/PI assay, and annexin-PI assay are expressed as mean ± standard deviation. Statistical significance was calculated using a Student’s T-test. P-values less than 0.05 were considered significant and are denoted by *, p-values less than 0.01 are denoted by **, p-values less than 0.001 are denoted by ***.
Results
Differentiation and cellular morphology by phase-contrast imaging
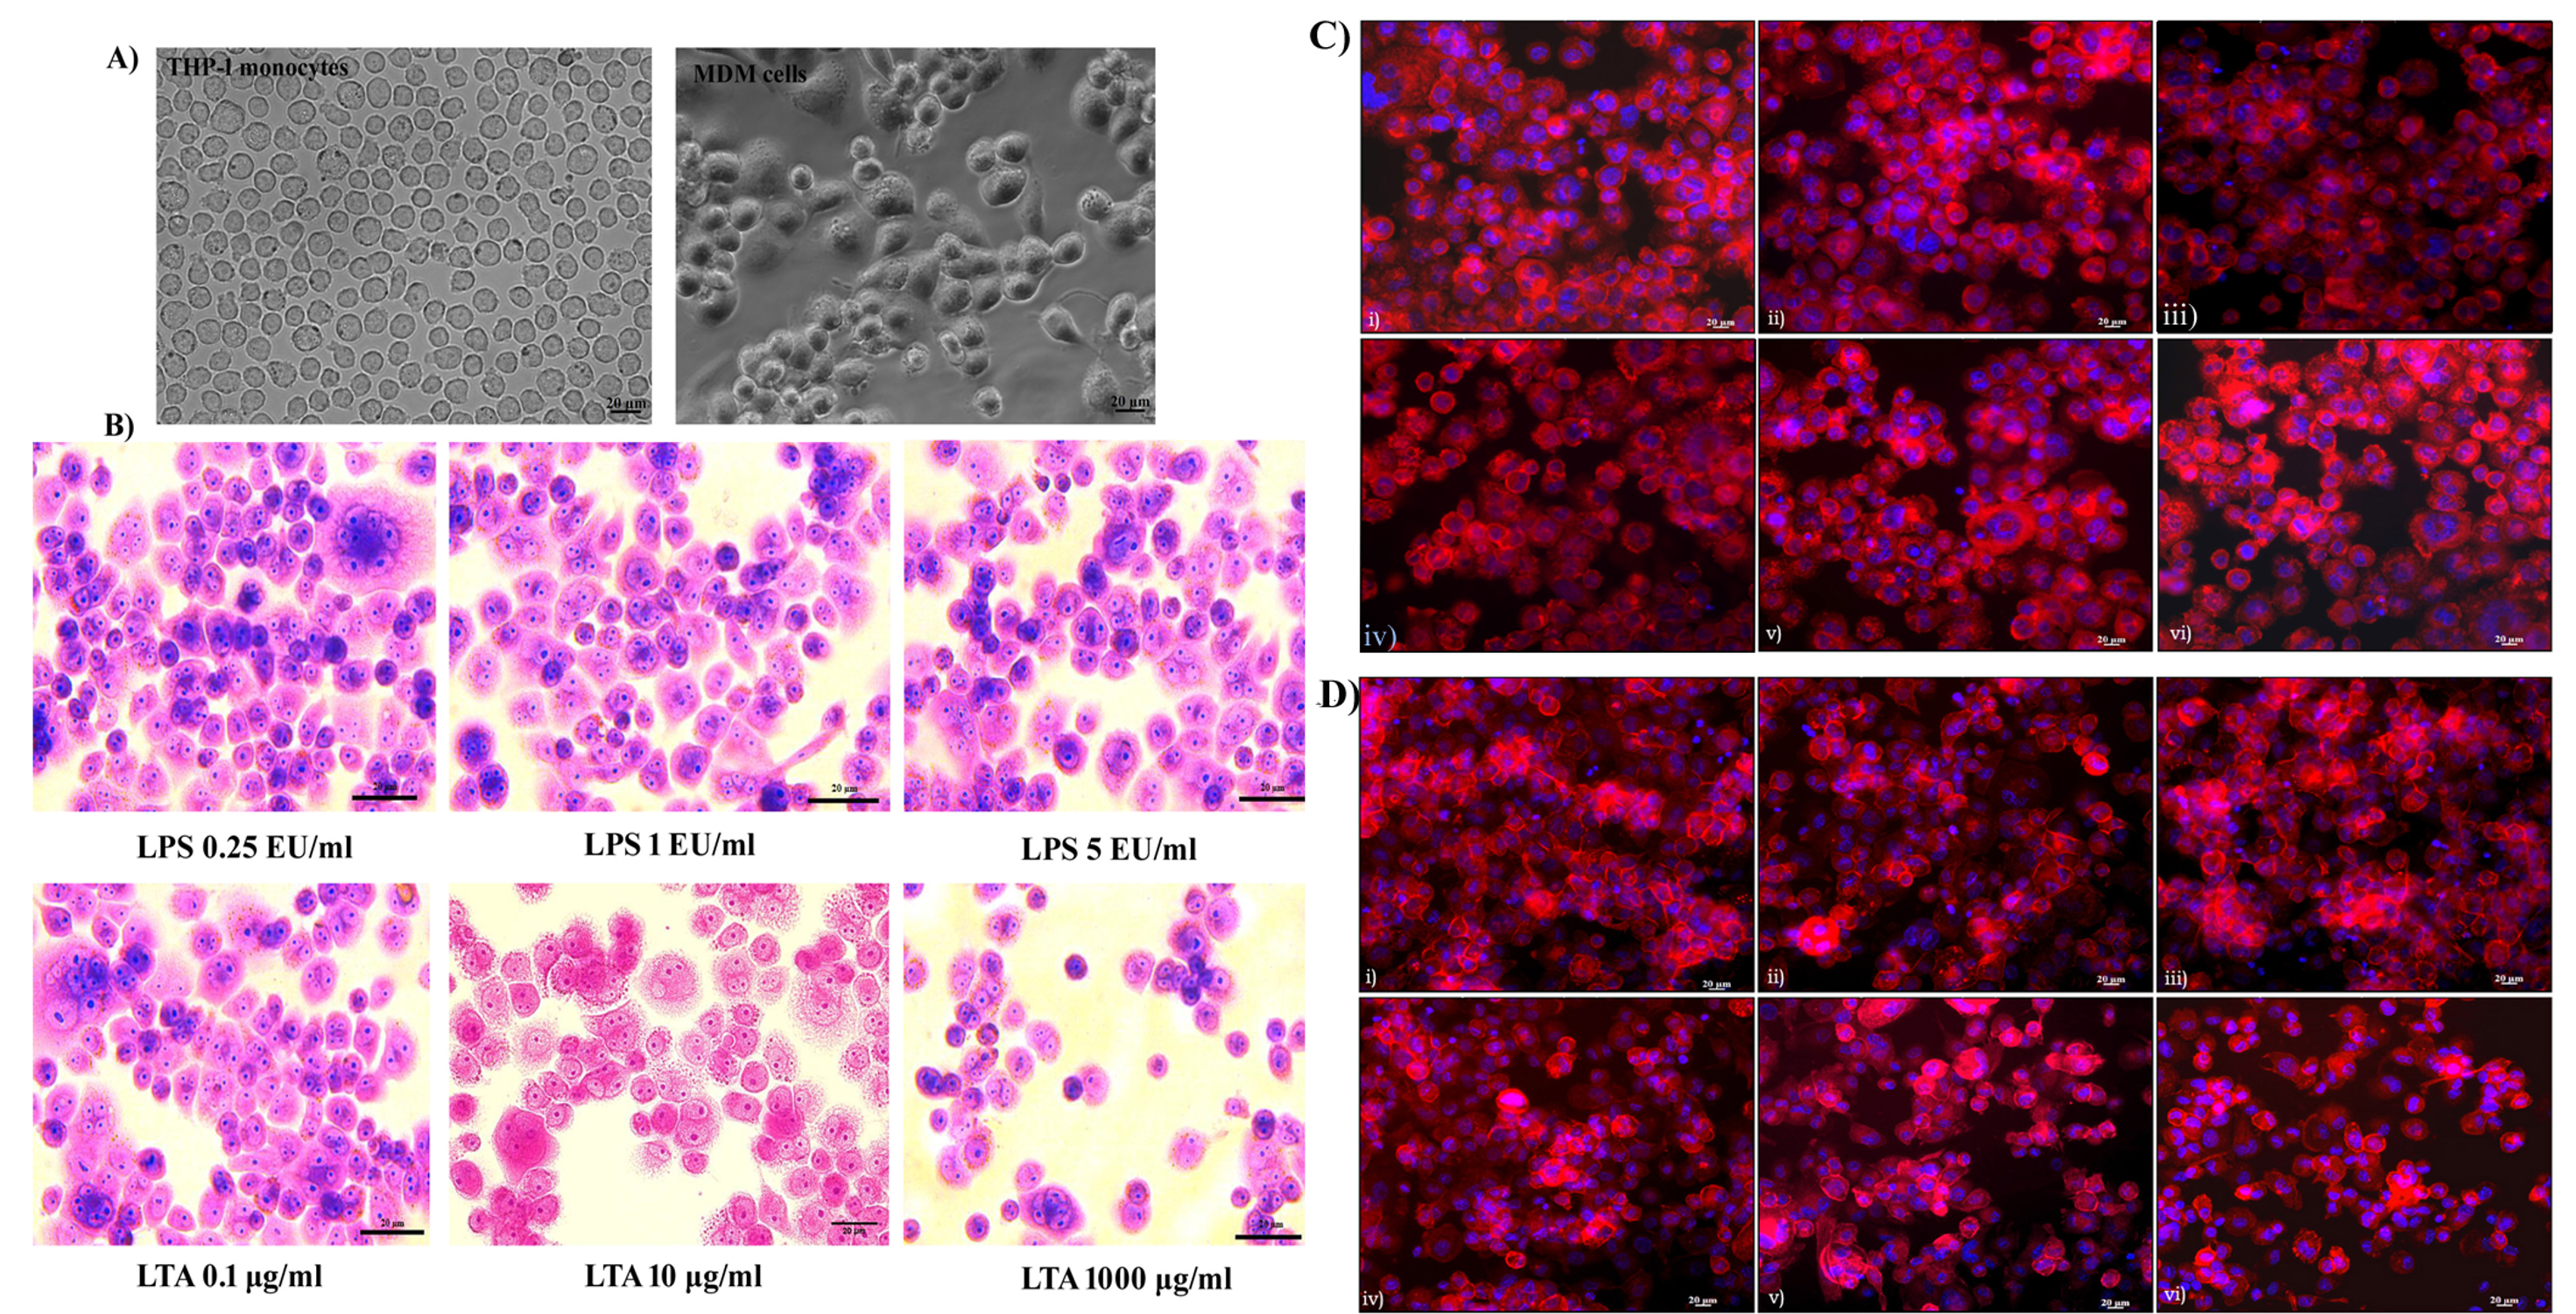
Differentiation of THP-1 monocytes to macrophages was observed under a phase-contrast microscope. The monocytes appeared to be round in morphology and existed in a suspension. Almost all of the cells (99%) were deemed to be of ideal size and shape and treatment with the mitogen PMA induced terminal differentiation of monocytes to macrophages. MDM cells showed characteristic phenotypes of macrophages, with extended pseudopodia and granular cytoplasms, and were attached to the bottom of the culture dish. Cellular morphology became uneven following differentiation, with cytoplasmic extensions evident. Differentiated macrophages exhibited different sizes and shapes (Figure 1A). Changes in cellular morphology following 24 hours of exposure to LPS and LTA were analyzed using Giemsa staining. It was noted that there was no characteristic change in morphology or cell adhesion properties following 24 hours of exposure of LPS up to 5 EU/mL. Similarly, 0.1 to 100 µg/mL of LTA did not affect the morphological characteristics of the MDM cells. However, exposure of cells to 1000 µg/mL of LTA caused a loss of cytoplasmic extensions, meaning the cells appeared round in morphology (Figure 1B).
Cytoskeletal integrity by rhodamine phalloidin staining
The cytoskeletal protein actin was stained with rhodamine phalloidine to assess its integrity. All untreated cells showed characteristic actin organization and adhered to the cell culture dish. No cytoskeletal rearrangement or actin destabilization was evident after 24 hours of exposure to 0.25 to 5 EU/mL of LPS (Figure 1C). Similarly, LTA exposure of 0.1 to 100 µg/mL had no significant effect on actin organization. However, LTA exposure of 1000 µg/mL caused significant rearrangement of actin organization. This resulted in the loss of characteristic cellular morphology, and the cells became more fragile. Actin destabilization led to the detachment of cells from the culture dish, with the morphology of the cells changing to round in shape. A visible reduction in the number of cells was observed following 1000 µg/mL of LTA exposure for 24 hours (Figure 1D).

Mitochondrial activity by MTT assay
As shown in the graph Figure 2(I-A), it was observed that LPS did not affect mitochondrial oxidation-reduction activity regardless of the dose MDM cells were exposed to. There was no significant reduction in formazan crystal formation in cells treated with 0.25 to 5 EU/mL of LPS for 24 hours, 48 hours, or 72 hours. The cellular mitochondrial function of LPS-treated cells was highly comparable with that of untreated control cells. Mitochondria seemed to maintain normal levels of activity following exposure to LTA up to 10 µg/mL for 24h. Compared to untreated control cells, a statistically significant decrease in mitochondrial activity was observed in cells exposed to 100 and 1000 µg/mL of LTA. This reduction in mitochondrial activity was statistically significant (p < 0.001). When the exposure time to LTA increased to 48 hours, a gradual, significant reduction in mitochondrial activity was observed for concentrations of 100 µg/mL (p < 0.01) and 1000 µg/mL (p < 0.001). After 72 hours of exposure to LTA, a significant loss of mitochondrial oxidation-reduction potential was observed across all concentrations (0.1 to 1000 µg/mL). Following 72 hours of exposure, an almost 40% — 60% reduction was observed for concentrations of 100 µg/mL (43.04 ± 0.002, p < 0.1) and 1000 µg/ml (35.7 ± 0.003, p < 0.01; Figure 2 [I-B]).
Lysosomal activity by neutral red uptake assay
Functional activity of lysosomes was quantitatively analyzed using a neutral red uptake assay for a period of 24 to 72 hours. It was noted that LPS did not induce a loss of lysosomal activity in MDM cells compared to negative control cells following 24 hours, 48 hours, and 72 hours of exposure. However, 48 hours and 72 hours of exposure to a 2 EU/mL concentration of LPS showed a statistically significant decrease in lysosomal activity (p < 0.05), despite more than 80% of cells still being viable at this concentration (Figure 2 [I-C]). As in the MTT assay, 24 hours of exposure to LTA caused a significant reduction in lysosomal activity at concentrations of 100 µg/mL (p < 0.05) and 1000 µg/mL (p < 0.01). LTA exposure induced a decline in lysosomal activity in a dose and time-dependent manner. After 48 hours and 72 hours of exposure to LTA, there was a drastic decline in the functional activity of lysosomes at LTA concentrations of 100 µg/mL (p < 0.01) and 1000 µg/mL (p < 0.01). Exposure to 1000 µg/mL of LTA caused a loss of lysosomal activity in 47% of cells following 72 hours of exposure compared to untreated cells (Figure 2 [I-D]).
Free radical generation by DCFHDA assay
Quantitative analysis of DCFHDA fluorescence found that LPS concentrations of 0.25 EU/mL to 5 EU/mL were insufficient to induce oxidative stress in MDM cells after up to 72 hours of exposure (Figure 2 [II-A]). However, LTA exposure had a positive effect on ROS generation in a dose and time-dependent manner. A significant increase in ROS was observed following 48 hours of LTA exposure at concentrations of 100 µg/mL (p < 0.01) and 1000 µg/mL (p < 0.01) and after 72 hours of exposure at the same concentrations of 100 µg/mL (p < 0.001) and 1000 µg/mL (p < 0.001). Incubation with the highest concentration of LTA (1000 μg/mL) resulted in a statistically significant production of ROS after 3 hours (22986.6 ± 801.30, p < 0.01). However, this increase became non-significant after 24 hours (36928 ± 1317.5, p > 0.05). An increase in exposure to time to 72 hours resulted in a significant induction of ROS generation, even at the 10 µg/mL concentration of LTA (38224 ± 2076.9, p < 0.01) (Figure 2 [II- B]).
Nitrile radical release by Griess assay
Griess assay was used to estimate RNS production in LPS-treated and LTA-treated cells. Figure 2 (II-C) shows that there was no stress-induced release of nitrile radicals following LPS exposure for 24 hours, 48 hours, and 72 hours. Graphs of all LPS concentrations are comparable with the results of the untreated control cells. An LTA exposure concentration of 100 µg/mL resulted in a significant increase in nitrile radical production after 48 hours (p < 0.05) and 72 hours (p < 0.05) of exposure. Regarding the difference in LTA concentrations, following 48 hours of LTA exposure, a significant increase in nitrile radical production was found at concentrations of 100 µg/mL (14.21 ± 0.0007, p < 0.05) and 1000 µg/ml (26.71 ± 0.096, p < 0.01). Following 72 hours of LTA exposure, the concentration of NO produced at an LTA concentration of 100 µg/mL (13.57 ± 0.012) was similar to the value obtained after 48 hours of exposure to the same concentration. However, at the 1000 µg/mL concentration, a significant increase in the concentration of NO produced was observed (32.78 ± 0.08, p < 0.01; Figure 2 [II-D]).

Lysosomal integrity by AO staining
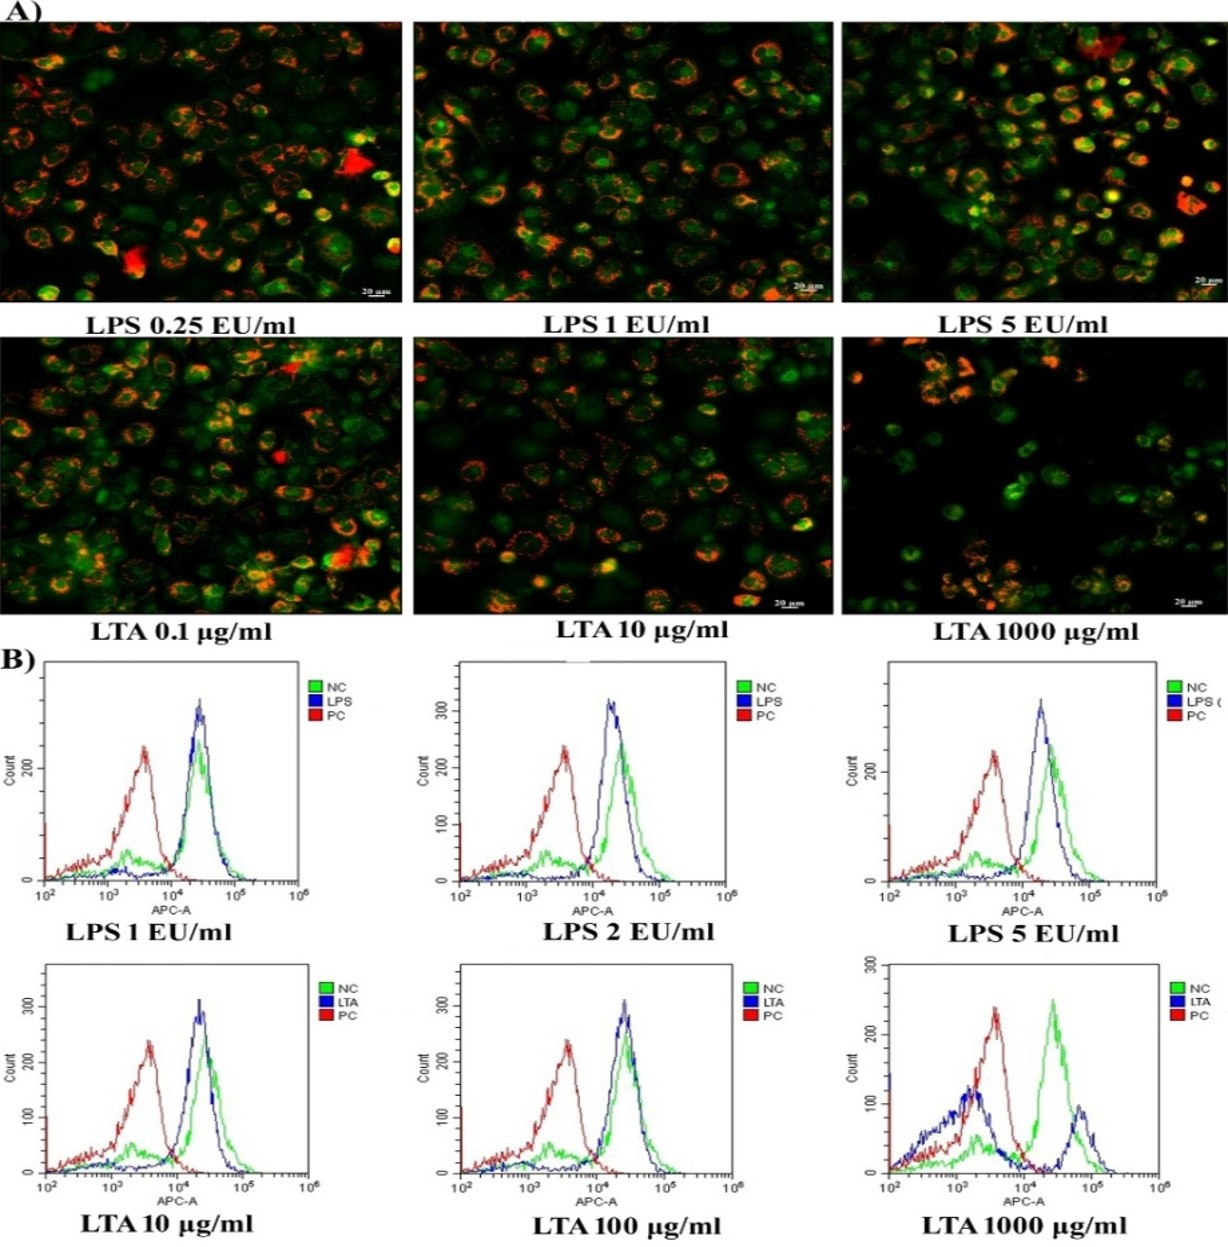
AO emits red fluorescence from active lysosomes. When there is a loss of lysosomal membrane integrity, lysosomal contents may flow from the vesicles to the cytoplasm. As shown in Figure 3A, it was observed that there was no lysosomal destabilization following 24 hours of exposure to 0.25 EU/mL to 5 EU/mL of LPS, with all cellular lysosomes emitting red fluorescence and, therefore, having intact lysosomal membranes. However, exposure of MDM cells to LTA caused a dose-dependent reduction in red fluorescence compared to untreated control cells. The number of green fluorescent cells increased following exposure to LTA concentrations of 100 µg/mL and 1000 µg/mL. A reduction in red fluorescence indicates that the lysosomal membrane was destabilized in LTA-treated cells, as can be seen in Figure 3B (v, vi).
Fluorescence imaging of MMP using JC1 dye
Disruption in cellular MMP was analyzed using a JC1 fluorescent probe following 24 hours of exposure to LPS and LTA. Cells with active MMP emit red fluorescence, while the JC1 dye emits green fluorescence when there is a loss of MMP. It was observed that there was no change in the MMP of MDM cells following exposure to 0.25, 1, and 5 EU/mL of LPS. Cellular mitochondria were found to be viable with active membrane potential, with the emission of red fluorescence representing the formation of J-aggregates inside the cells (Figure 4A). Low concentrations of LTA (0.1 and 10 µg/mL) also had no deteriorating effects on MMP. However, 24 hours of exposure to 1000 µg/mL of LTA resulted in a reduction of red fluorescence an increase of green fluorescence, indicating the loss of MMP, as shown in Figure 4A.
FACS analysis of MMP by DilC1 (5) assay
In healthy living cells, the maintenance of MMP in a narrow range is crucial for the production of ATP and associated cellular viability. Along with JC1 fluorescent imaging, the present study evaluated the loss of MMP following exposure to LPS and LTA using a DilCI (5) fluorescent probe. It was observed cells exposed to 1 EU/mL of LPS showed similar fluorescent intensity as the untreated control cells. However, in cells exposed to 2 EU/mL and 5 EU/mL concentrations of LPS, the DiIC1 (5) fluorescence shifted towards the left of negative control, indicating a slight reduction in the MMP of treated cells (Figure 4B). The graph of DiIC1 (5) following exposure to 10 µg/mL and 100 µg/mL of LTA shows similar results to those observed following JC1, namely that the treated cells were viable with active MMP. However, exposure to 1000 µg/mL of LTA induced a loss of MMP in more than 80% of cells, resulted in a shift in the intensity of DilC1 (5) fluorescence towards that seen in the positive control. As shown in Figure 4B, only 20% of cells had active MMP that remained comparable with the untreated control cells following exposure to 1000 µg/mL of LTA.

Lactate dehydrogenase release assay
A loss of cell membrane integrity and the release of LDH into the extracellular matrix was analyzed using the CyCOUNT LDH release assay. No significant loss of membrane integrity or release of LDH was observed following 24 hours and 48 hours of exposure to 0.25 EU/mL to 5 EU/mL of LPS. When the time of exposure increased to 72 hour, there was a significant increase in LDH release at LPS concentrations of 2 EU/mL (p < 0.05) and 5 EU/mL (p < 0.05; Figure 5A). Like LPS, LTA exposure up to concentrations of 10 µg/mL had no significant impact on cell membrane integrity and associated LDH release, regardless of the exposure period. LDH release was observed following 24 hours of exposure to 100 µg/mL of LTA and increased in a time-dependent manner. An LTA concentration 1000 µg/mL was cytotoxic depending on time, showing significant impacts after 24 hours (p < 0.001) and 72 hours (p < 0.001) of exposure (Figure 5B).
Calcein AM/PI assay
The calcein-AM/PI dual staining method was employed to detect the alive and dead MDM cells following up to 3 days of LPS and LTA with time intervals of 24 hours. As shown in Figure 5C, no significant difference in the fluorescent intensity following LPS exposure was observed compared to the untreated control. Exposure of LPS to MDM cells did not induce a loss of membrane integrity or increase permeabilization to PI. There was no substantial reduction in calcein-AM signaling even after 24 hours (3.74 ± 0.22) and 48 hours (3.59 ± 0.19) of exposure to 5 EU/mL of LPS. However, a significant reduction in the ratio of calcein-AM to PI fluorescence following 72 hours of exposure to 5 EU/mL of LPS was observed (3.18 ± 0.12, p < 0.01). Contrary to exposure to LPS, LTA exposure was toxic, as seen in the other assay results. Exposure to increasing concentrations of LTA resulted in a corresponding decrease in the fluorescence ratio and elicited significant membrane permeabilization in MDM cells. Reduction in the number of live cells was observed after 72 hours of exposure to 1 µg/mL of LPS. The ratio of live and dead cells following 24 hours and 48 hours of exposure remained comparable with the untreated control. Exposure to 10, 100, and 1000 µg/mL of LTA increased the ratio of PI-positive cells in a time-dependent manner. These results suggest an exponential increase in the number of dead cells in all three exposure periods for LTA. The reduction was significant following 72 hours of exposure for concentrations of 100 µg/mL (p < 0.01) and 1000 µg/mL (p < 0.001; Figure 5D). Fluorescent imaging results of the calcein-AM/PI stains are depicted in Figure 5E. Following 24 hours of exposure to 0.25, 1, and 5 EU/mL of LPS, the majority of calcein-AM-stained cells were found to emit green fluorescence. Furthermore, 80% of cells appeared viable following 24 hours of exposure to 0.1 and 10 µg/mL of LTA. However, the number of PI-positive cells appeared to increase following exposure to 1000 µg/mL of LTA.

Annexin V/PI apoptosis assay
The induction of apoptosis and necrosis in MDM cells was assessed following 24 hours of exposure to LPS and LTA, using annexin V-FITC flow cytometry. From this analysis, it was noted that 89.54% of cells in the untreated control were unstained and viable. Similarly, more than 85% of cells were found in the lower left quadrant of the gated population after 24 hours of exposure with 0.25 to 5 EU/mL of LPS, indicating the absence of apoptotic or necrotic death induction in LPS-treated cells. Less than 2.5% of cells were found to be in the early (Annexin [+] PI [-]) and late (Annexin [+] PI [+]) apoptotic stages. Even at the highest concentration of LPS, only 1.5% of cells entered into the necrotic (Annexin [-] PI [+]) stage of cell death (Figure 6A). Exposure for 24 hours to 0.1 to 100 µg/mL of LTA did not induce significant apoptotic or necrotic cell death in MDM cells. Approximately 80% of treated cells were found to be unstained after up to 100 µg/mL of LTA treatment. However, the proportion of apoptotic and necrotic cells increased in a dose-dependent manner, with the percentage of apoptotic cells increasing from 7% to 10% and necrotic cells increasing from 0.8% to 4%. At a concentration of 1000 µg/mL of LTA, the viable cell number was reduced to 69.52%. It was observed that 16.99% of cells were in the early apoptotic stage of cell death (Annexin [+] PI [-]), 6% were in the late apoptotic stage (Annexin [+] PI [+]), and 8% were in the necrotic stage (Annexin[-] PI [+]; Figure 6B). The percentage of cells in each stage following exposure to LPS and LTA are shown in Figure 6C-D, respectively. The images showing early apoptotic, late apoptotic, and necrotic stages of cell death were visualized in channels 2 and 5 of the flow cytometer as green, red, and green + red fluorescence.
Gene expression by qRT-PCR
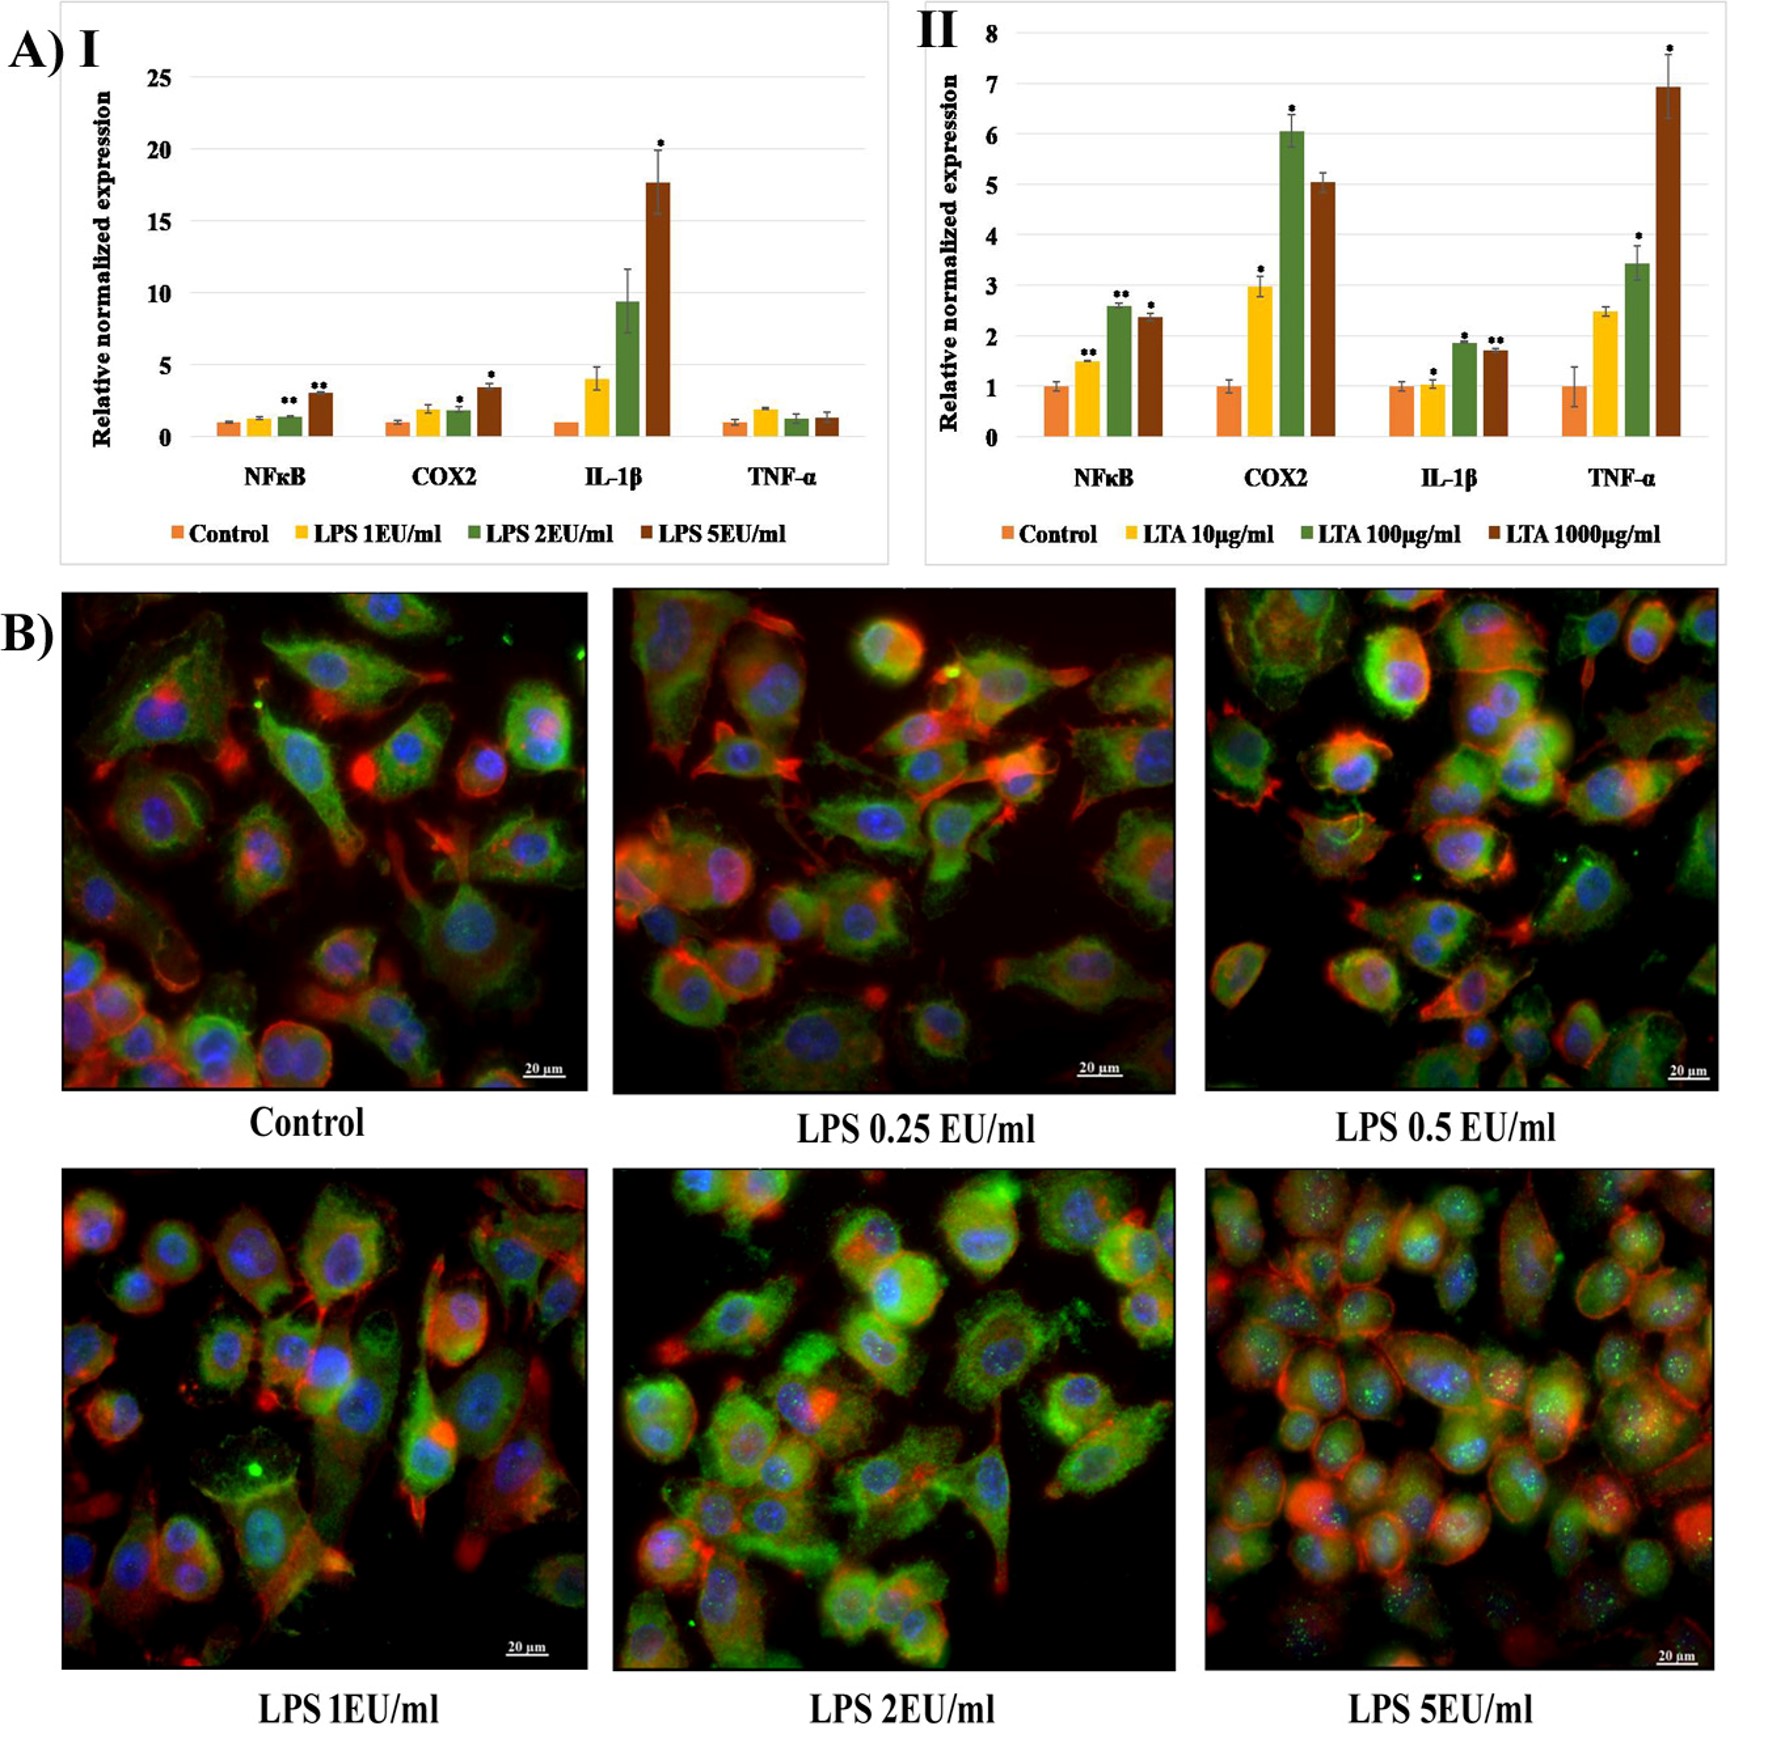
The expression of genes involved in the immune signaling mechanism following LPS and LTA exposure was analyzed using the qRT-PCR technique. NFкB genes that regulate the transcription of inflammatory cytokines, COX2 genes responsible for the synthesis of PGs, and genes encoding IL-1β and TNF-α were quantified following 24 hours of exposure to LPS (1, 2a, and 5 EU/mL) and LTA (10, 100, and 1000 µg/mL). It was observed that 24 hours of exposure to select concentrations of LPS caused a dose-dependent increase in the expression of NFκB, COX2, and IL-1β in MDM cells. The expression of NFкB following exposure to 2 and 5 EU/mL of LPS was significantly increased (p < 0.01). COX2 expression was also significantly increased at the same concentrations (p < 0.05). A 4 to 16-fold increase in IL-1β expression was observed after exposure to 1, 2, and 5 EU/mL of LPS. However, the expression of TNF-α was similar to that of the untreated control (Figure 7[A-I]). LTA exposure resulted in a marked increase in the expression of all four inflammation-associated genes. A dose-dependent increase in the expression of NFκB, IL-1β, and TNF-α was observed following LTA exposure. A 6-fold increase in COX2 expression was observed following exposure to 100 µg/mL of LTA, and a 7-fold increase in TNF-α expression was observed following exposure to 1000 µg/mL (Figure 7A [II]).
Immunocytochemistry for nuclear translocation of NFкB
LPS-induced activation and nuclear translocation of NFкB were analyzed by immunocytochemistry analysis (ICC) using a fluorescent microscope (Axioscope). The cells were counterstained with cytopainter (red), and the nuclei were stained with DAPI (blue). An increase in the intensity of green fluorescence of FITC-labeled anti-NFкB cells was observed following exposure to 2 and 5 EU/mL of LPS. In addition, translocation of cytoplasmic NFкB to the nuclei was visible through imaging as green spots inside the nuclei following exposure to 5 EU/mL of LPS (Figure 7B).

NFкB activation by FACS analysis
The interaction of LPS and LTA with specific receptors on immune cells activates inflammation signals. The signal transmission involves adaptor molecules and the activation of transcription factors, including NFкB. From the FACS analysis, it was found that LPS and LTA induced NFкB activation in THP-1 cells in a dose-dependent manner. Following the exposure of cells to LPS, activation of NFкB was detected at a rate of 3.0% (1 EU/mL), 4.97% (2 EU/mL), and 13.2% (5 EU/mL). Following exposure to LTA, the cells showed NFкB activation rates of 29.8% (10 µg/mL), 52.8% (100 µg/mL), and 82.3% (1000 µg/mL; Figure 8A).
COX2 activation by FACS analysis
COX is an enzyme involved in the synthesis of PGs. PGs act as mediators of pyrogenic responses in the CNS. It was observed that 5 EU/mL of LPS induced significant activation of COX2 in treated cells. However, compared to untreated control cells, the percentage of cells exhibiting COX2 activation was low after exposure to 1 and 2 EU/mL of LPS l. Exposure to LTA (10, 100, and 1000 µg/mL) did not induce COX2 signals in treated cells compared to untreated control cells. As shown in Figure 8B, there was no characteristic shift of fluorescence towards the right of the negative control in treated cells following LTA exposure.
Discussion
Pyrogenic contamination in parenteral products may cause moderate to severe health complications in humans and animals. Activation of immune cells by exogenous pyrogens leads to the induction of inflammation and the release of pyrogenic cytokines. Pyrogenic cytokines such as IL-1β, IL-6, and TNF-α are mediators of fever and febrile reactions in humans. During pyrogenic interaction, PGs are released from the thermoregulatory center of the hypothalamus and are associated with the induction of fever and febrile reactions10. Immune cells, particularly monocytes and macrophages, are the key mediators of the innate immune system and are involved in the phagocytosis and the elimination of foreign particles. Depending upon the inflammatory response, monocytes may differentiate into macrophages and migrate to various organs and tissues. Loss of activity or death of these monocytes and macrophages negatively affects the normal homeostasis of the immune system, leading to serious human health issues. LPS and LTA are the most common bacterial pyrogenic contaminators seen in biological preparations. For assessing the cytotoxicity of biological and chemical toxicants, understanding the normal function of cellular organelles is essential. Since mitochondria function as the powerhouse of a cell, any change in membrane potential or in the oxidation-reduction pathway may result in a loss of cell viability. In the present study, THP-1 cells served as a model for monocytes and MDM cells. Inflammation usually induces monocytes to differentiate to the characteristic M1 phenotype, whereas anti-inflammatory signals stimulate differentiation into the M2 phenotype. Therefore, monocyte differentiation alters the cell’s morphological characteristics, adherence properties, and inflammatory responses11.
MTT and neutral red assays were carried out to assess organelle function regarding mitochondrial reduction potential and lysosomal dye uptake. It was observed that regardless of concentration, LPS had no significant effect on the mitochondrial oxidation-reduction potential and lysosomal phagocytic potential of MDM cells. Morphological characteristics observed under rhodamine-phalloidin and Giemsa staining also indicated a non-toxic impact of LPS on cell morphology and membrane integrity. Similar to those observations, it was also found that LPS was non-cytotoxic to human airway epithelial cells at low concentrations. Previous studies have noted that LPS-mediated cytotoxicity in monocytes required long-term exposure for a period of more than 72 hours12. Pyrogenic responses by gram-positive bacteria rely on the LTA component of their cell walls. In the present study, LTA, acquired from Bacillus subtilis, displayed cytotoxicity in a dose and time-dependent manner. There was a significant loss of mitochondrial and lysosomal activity in MDM cells within 48 to 72 hours of LTA exposure. At higher concentrations of LTA exposure, cellular actin filament organization became disrupted and detached from the culture plate. Rounding of cells and the loss of the characteristic macrophage extensions indicated impairment of the actin filaments and membrane destabilization. The presence of serum in cell culture media has been previously reported as playing a prominent role in the cytotoxicity of LTA derived from Streptococcus pyogens in mouse fibroblast monolayers. As per the studies of Leon and Panos, the toxic effect of LTA has been reported to be associated with the inhibition of collagen synthesis and cell membrane destabilization13.
Free radicals are highly reactive, unstable atomic species that contain an unpaired electron in their outermost orbital. The generation and propagation of free radicals is linked to various diseases and aging in humans. Inflammation and free radical generation are both associated with exogenous pyrogen exposure and can lead to apoptotic or stress-induced death of immune cells. Spitzer et al. (2020) reported oxidative stress induction in rodent mammary glands after in vivo administration of E. Coli LPS. LPS can activate superoxide dismutase 1 (Sod1) and NQO1 enzymes to increase the release of H2O2 inside the cell14. In the present study, the selected concentrations of LPS were insufficient to cause any free radical generation and oxidative stress in MDM cells, even after 72 hours of exposure. There have been reports of time-dependent death of mixed neuronal-glial cells by LTA derived from Staphylococcus aureus. However, the proliferation of glial and astrocyte cells has also been reported after 72 hours of incubation with LTA, with it being noted that short-term exposure to LTA was insufficient to induce direct cellular toxicity in neuronal cells. The coordinated release of inflammatory cytokines from astrocytes and nitrile radicals from microglia leads to stress-induced neuronal cell death. Previous studies have found evidence that nitrile radicals and the associated superoxide anion production play significant roles in the LTA-mediated toxicity of neuronal cells15. The present study observed that LTA induced time and dose-dependent hydroxyl and nitrile radical generation in MDM cells. Long-term exposure to as little as 10 µg/mL of LTA caused a significant rise in the hydroxyl radical production in MDM cells. Oxidative stress ultimately leads to cellular death when ROS production exceeds the resistance provided by the antioxidant defense mechanism of cells. Previous studies have reported that LTA is capable of inducing oxidative stress in heart-derived H9c2 myogenic cells, with a significant reduction in the expression of the antioxidant enzymes superoxide dismutase, catalase, and glutathione peroxidase seen in the cells. LTA also activates inflammatory pathways through the induction of p38 and the JNK pathway16.
MMP is maintained in a narrow range to keep the critical cellular processes of cellular respiration and ATP generation functioning. Loss of MMP results in a sudden drop in cellular ATP level and, consequently, cell death. The present study found that the MMP of THP-1 cells was not affected by 72 hours of exposure to LPS concentrations of 0.25 to 5 EU/mL. The orange-red fluorescence observed in JC1 staining also confirmed the presence of active MMP in LPS-treated MDM cells. The selected concentrations of LPS were, therefore, insufficient to cause mitochondrial dysfunction and reduction in MMP. However, mitochondrial fragmentation, metabolic shifts, ROS production, and increased MMP in microglial cells following 24 hours of exposure to LPS have been previously associated with NFкB and MAPK-activated metabolic reprogramming in microglial cells. The pro-inflammatory state of these microglial cells has been associated with mitochondrial fission and increased production of ROS and RNS17. Mitochondrial dysfunction associated with bacterial sepsis is a critical event in inflammatory injury and cell death. In the present study, LTA exposure led to a dose-dependent loss of MMP in THP-1 cells. The coordinated action of the ATP synthase complex, cytochrome c, and membrane anchoring proteins is involved in MMP regulation in cells. Toll-like receptor 2 (TLR2) mediated signaling, which is associated with bacterial sepsis, plays a role in intracellular H2O2 and mitochondrial O2 production. It has been reported that LTA can induce the release of cytochrome c and can, therefore, be associated with the loss of MMP in H9c2 cells18. ATP depletion and the ensuing associated acidosis, the release of cytochrome c, and the dysfunction of electron transferring protein complexes in the electron transport chain can create instability in MMP.
Lysosomes mediate autophagy, exocytosis, and degradation of cellular components and are necessary for the proper functioning of immune cells. Lysosomes act as the crossroad for various metabolic and catabolic functions. As lysosomes have an essential role in cell survival, previous research has focused on lysosomes as therapeutic targets for multiple diseases. Lysosomal membrane destabilization and the subsequent release of hydrolytic enzymes into the cytosol activates the lysosome-dependent death pathway. The present study observed that LPS concentrations up to 5 EU/mL did not induce lysosomal membrane destabilization. LPS interaction with TLR4 receptors activates signaling through TRIF (TIR-domain-containing adaptor-inducing interferon-ß), resulting in the apoptotic death of macrophages principally through lysosomal dysfunction19. In the present study, lysosomal membrane destabilization was observed using AO staining following 24 hours of exposure to LTA. The results correlate with those seen in the neutral red assay, where the phagocytic potential of lysosomes was significantly affected in a dose and time-dependent manner. Bacterial exotoxins form membrane pores when exposed to acidic pHs, which, in turn, drives these toxins into the lysosomes. Exotoxin-mediated oxidative stress releases ROS and RNS. Diffusion of these ROS into lysosomes results in lipid peroxidation and membrane destabilization. Lysosomal membrane permeabilization is considered the primary or secondary route of cell death executed via apoptotic or necrotic mechanisms20. The present study investigated the ability of endotoxins and exotoxins to induce apoptotic or necrotic death using the dual fluorescent probe annexin V/PI. LPS and LTA were found to induce apoptosis in THP-1 MDM cells. Klein et al. (2001) reported the LPS-mediated inhibition of apoptosis in human neutrophils through the extracellular regulated kinase pathway. Recent studies have also found no significant indication of phosphatidylserine externalization following exposure to LPS in THP-1 cells 21. In the present study, the highest concentration of LTA was found to cause apoptotic cell death in THP-1 cells. A recent study examining LTA-induced apoptosis in microglial cells through the augmented activation of the inducible nitric oxide synthase enzyme supports this finding22.
Interaction of LPS with TLR4 present on monocytes and macrophages initiates various inflammatory signaling pathways. Transduction of TLR4 signaling is dependent on adaptor molecules such as MyD88 and TRIF-TRAM. TLR4 signaling via adaptor molecules initiates pro-inflammatory gene expression. NFкB is the most recognized and studied transcription factor involved in LPS-TLR4 inflammation signaling. Phosphorylation of the p65 subunit of NFкB plays a crucial role in the activation, translocation, and specificity of downstream signaling. Translocation of cytosolic NFкB to the nucleus is required for the active expression of the pro-inflammatory cytokine genes. However, phosphorylation of p65 and, therefore, the translocation of NFкB depends on the concentration and strength of LPS-TLR4 binding23. In the present study, immunocytochemistry analysis of MDM cells following LPS treatment showed a dose-dependent increase in NFкB activation. Therefore, LPS, even at nanogram concentrations, is capable of inducing NFкB translocation in MDM cells. Furthermore, the present study found that LPS interacts with TLR and IL-1 superfamily receptors to enable the transduction of signals to immune cells. The IL-1 family of cytokines convey inflammatory signals through MyD88, IRAK, IRAK2, and TRAF6 adaptor molecules for the activation of NFкB. LPS utilizes a similar pathway in THP-1 cells. LPS-mediated NFкB activation induces the production and release of IL-1β, IL-6, and TNF-α, eventually leading to a pyrogenic response in humans24.
Inflammation induced by LTA occurs following a cascade of phosphorylation and dephosphorylation of kinase enzymes in immune cells. LTA can induce the expression of nitric oxide synthase enzyme (iNOS) and the subsequent release of NO radicals in macrophages. Expression of iNOS in macrophages is linked with protein kinase C-mediated NFкB activation25. Instead of TLR4 in LPS inflammation, LTA transmits inflammatory signals via TLR2 receptors. In vivo studies, using mice models, conducted with LTA derived from Streptococcus pneumonia demonstrated the role of TLR2-mediated activation in neutrophil influx and inflammatory cytokine release26. LTA-TLR2 receptor interaction in macrophage cells activates the tyrosine kinase, PI3K/Akt, and p38 MAPK signaling pathways. Activated kinases can cause a marked increase in NFκB-specific DNA–protein complex formation. DNA-protein complex formation is an indicator of translocated NFκB, which, in turn, promotes the transcription of iNOS and pro-inflammatory cytokine genes27. The present study detected a dose-dependent activation of NFκB in THP-1 cells exposed to LTA, suggesting a possible immunotoxic potential of bacterial exotoxins in human monocytes.
Pathogenic contamination during medical procedures can lead to multi-organ failure and death in patients due to septic shock. Septic shock is initiated preliminarily as inflammation, followed by the activation of NFκB and COX2. Previous studies have reported COX2 activation following exposure to LPS in mouse transformed Clara cells28, RAW264.7 macrophages 29, IEC-6 cells30, and human neutrophils31. COX2 expression induces multiple responses in different cells. Reports of COX2 activation strongly support LPS-induced immune activation in various cell types. There are various adaptor molecules for COX2 activation following LPS exposure. COX2 activation involves the phosphorylation of MAPK proteins, JNK, p38, and/or ERK, and the activation of Tpl2-dependent CREB and NFκB. COX2 activation eventually leads to the release of PGE2, Thromboxane A2, and pro-inflammatory cytokines. Expression of NFκB, COX2, and inflammatory cytokines in THP-1 cells following LPS exposure suggests the potential for low concentrations of LPS to activate the immune response in THP-1 cells. However, the same low concentrations do not show a direct cytotoxic effect. Similar to LPS, LTA also induced increased expression of COX2 in THP-1 cells. However, the present study failed to identify specific activations of COX2 signals in both LPS and LTA-treated cells. LTA can interact with the CD14 receptor and activate NFκB-mediated inflammation signaling. Neuronal inflammation induced by bacterial toxins has been reported in rat cortical neuronal cells. It has also been previously reported that LTA can activate COX2 and PGE2 synthesis through PTK, PC-PLC, PI-PLC, and ERK pathways32. Similarly, cytosolic phospholipase A2 (cPLA2), COX-2, PGE2, and IL-6 have been found to be elevated in LTA-exposed human tracheal smooth muscle cells. LTA interacts with TLR2 receptors and activates NFκB through MyD88, PI3K, Rac1, Akt, and MAPK pathways, ultimately resulting in inflammation signaling33.
Even though the in vitro system interacts and responds to pyrogenic contaminations, results of in vitro system studies are not comparable with those of in vivo system studies, as cancerous cell lines, such as THP-1, are somewhat resistant to toxic interactions with LPS and LTA. The concentrations of LPS that can cause severe life-threatening reactions in an in vivo system are non-toxic to THP-1 and MDM cells. Similarly, concentrations of LTA above 10 µg/mL can induce a direct toxic response to THP-1 cells. The interaction of cells in an in vitro system differs from the interaction of cells, organs, and systems of living subjects during an in vivo inflammatory reaction. Considering these limitations, the present study highlights that selective inhibitors of NFκB, COX2, and pyrogenic cytokines may be promising factors for treating and preventing pyrogen-induced episodes of fever and febrile reactions in humans.
Conclusions
LPS and LTA are the most potent pyrogens of bacterial origin. LPS and LTA, even at nanogram concentrations, are capable of inducing a pyrogenic response in humans. Pyrogenic cytokines such as IL-1β, IL-6, and TNF-α synergistically act at the thermoregulatory center of the hypothalamus and induce fever and febrile reactions. The present study investigated the cellular and immunological response of THP-1 cells after exposure to LPS and LTA. The selected concentrations of LPS were insufficient to cause direct cytotoxicity to THP-1 and MDM cells. However, LTA exposure led to a significant loss of organelle function and membrane integrity in a dose and time-dependent manner. Free radical generation, lysosomal destabilization, and the induction of apoptotic cell death are the principal factors behind LTA-mediated toxicity in monocytes. The expression of genes involved in the inflammatory pathway and pyrogenic cytokines were augmented in both LPS and LTA-treated cells. The present study found that even nanogram concentrations of LPS and LTA can cause immune activation in THP-1 and MDM cells without overt cytotoxicity. An interconnected cellular and cytokine signaling network is, therefore, necessary to elicit a profound immune response in a living system.
Abbreviations
AO: Acridine Orange
CCCP: cyanide 3-chlorophenylhydrazone
CNS: central nervous system
COX: cyclooxygenase
DCFH-DA: 2′7′ -dichlorofluorescein diacetate
DiIC1(5): 1,1′,3,3,3′,3′-hexamethylindodicarbo-cyanine iodide
E. Coli: Escherichia coli
FITC: Fluorescin isothiocyanate
IL-1β: interleukin-1beta
IL-6: interleukin-6
JC1: 5,5′,6,6′-tetrachloro-1,1′,3,3′-tetraethylbenzimi- dazolylcarbocyanine iodide
LDH: Lactate Dehydrogenase
LPS: Lipopolysaccharides
LTA: Lipoteichoic acid
MDMs: monocyte-derived macrophages
MMP: Mitochondrial membrane potential
MTT: 3-(4, 5-dimethylthiazol-2-yl)-2,5-diphenyltetrazolium bromide
NFkB: nuclear factor-kappa b
PG: prostaglandin
PI: Propidium Iodide
PMA: Phorbol 12-myristate 13-acetate
POA: pre-optic area of the anterior hypothalamus
PS: Phosphatidyl serine
qRTPCR: Quantitative real-time polymerase chain reactions
RNS: Reactive nitrogen species
ROS: Reactive oxygen species
TNF-a: tumor necrosis factor-alpha
Acknowledgments
The authors wish to express their thanks to the Director and Head, Biomedical Technology Wing, Sree Chitra Tirunal Institute for Medical Sciences and Technology, Trivandrum, Kerala, India, for their support and for providing the infrastructure to carry out this work. Prajitha thanks the Council of Scientific and Industrial Research, New Delhi, for the SRF Fellowship.
Author’s contributions
Mohanan: Corresponding author: conception, design of the study, analysis and interpretation of data, critical revision and final approval.
Prajitha: Acquisition of data, drafting, interpretation of data.
All authors read and approved the final manuscript.
Funding
There is no funding from outside agencies. The infrastructure support is provided by the parent Institute.
Availability of data and materials
The authors declared that the research data referred correctly cited in the manuscript’s reference section. All the raw data are available with the parent institute.
Ethics approval and consent to participate
Ethical approval is not applicable since the present work is fully an in vitro work. All experiments are in vitro in nature; the consent part from the subject is not applicable in the study.
Consent for publication
All the authors agreed to submit the manuscript in the journal. The same has approved by the parent Institute.
Competing interests
The authors declare that they have no competing interests.
References
-
Gaines Das
R.E.,
Brügger
P.,
Patel
M.,
Mistry
Y.,
Poole
S.,
Monocyte activation test for pro-inflammatory and pyrogenic contaminants of parenteral drugs: test design and data analysis. Journal of Immunological Methods.
2004;
288
(1-2)
:
165-77
.
View Article PubMed Google Scholar -
Garrana
R.,
Mohangi
G.,
Malo
P.,
Nobre
M.,
Leakage of microbial endotoxin through the implant-abutment interface in oral Implants: an in vitro study. BioMed Research International.
2016;
2016
:
9219071
.
View Article PubMed Google Scholar -
Walter
E.J.,
Hanna-Jumma
S.,
Carraretto
M.,
Forni
L.,
The pathophysiological basis and consequences of fever. Critical Care (London, England).
2016;
20
(1)
:
200
.
View Article PubMed Google Scholar -
Anochie
I.P.,
Mechanisms of fever in humans. International Journal of Microbiology and Immunology Research.
2013;
2
(5)
:
37-43
.
-
Sobolewski
C.,
Cerella
C.,
Dicato
M.,
Ghibelli
L.,
Diederich
M.,
The role of cyclooxygenase-2 in cell proliferation and cell death in human malignancies. International Journal of Cell Biology.
2010;
2010
:
215158
.
View Article PubMed Google Scholar -
Quan
N.,
Whiteside
M.,
Herkenham
M.,
Cyclooxygenase 2 mRNA expression in rat brain after peripheral injection of lipopolysaccharide. Brain Research.
1998;
802
(1-2)
:
189-97
.
View Article PubMed Google Scholar -
Cao
C.,
Matsumura
K.,
Yamagata
K.,
Watanabe
Y.,
Induction by lipopolysaccharide of cyclooxygenase-2 mRNA in rat brain; its possible role in the febrile response. Brain Research.
1995;
697
(1-2)
:
187-96
.
View Article PubMed Google Scholar -
Dlugosz
E.,
Basalaj
K.,
Zawistowska-Deniziak
A.,
Cytokine production and signalling in human THP-1 macrophages is dependent on Toxocara canis glycans. Parasitology Research.
2019;
118
(10)
:
2925-33
.
View Article PubMed Google Scholar -
Sokolova
T.M.,
Poloskov
V.V.,
Shuvalov
A.N.,
Rudneva
I.A.,
Timofeeva
T.A.,
Signal Immune Reactions of Macrophages Differentiated from THP-1 Monocytes to Infection with Pandemic H1N1PDM09 Virus and H5N2 and H9N2 Avian Influenza A Virus. Bulletin of Experimental Biology and Medicine.
2018;
164
(5)
:
636-40
.
View Article PubMed Google Scholar -
Dinarello
C.A.,
Infection, fever, and exogenous and endogenous pyrogens: some concepts have changed. Journal of Endotoxin Research.
2004;
10
(4)
:
201-22
.
PubMed Google Scholar -
Lund
M.E.,
To
J.,
O'Brien
B.A.,
Donnelly
S.,
The choice of phorbol 12-myristate 13-acetate differentiation protocol influences the response of THP-1 macrophages to a pro-inflammatory stimulus. Journal of Immunological Methods.
2016;
430
:
64-70
.
View Article PubMed Google Scholar -
Liu
X.,
Yin
S.,
Chen
Y.,
Wu
Y.,
Zheng
W.,
Dong
H.,
LPS‑induced proinflammatory cytokine expression in human airway epithelial cells and macrophages via NF‑κB, STAT3 or AP‑1 activation. Molecular Medicine Reports.
2018;
17
(4)
:
5484-91
.
View Article PubMed Google Scholar -
Leon
O.,
Panos
C.,
Cytotoxicity and inhibition of normal collagen synthesis in mouse fibroblasts by lipoteichoic acid from Streptococcus pyogenes type 12. Infection and Immunity.
1983;
40
(2)
:
785-94
.
View Article PubMed Google Scholar -
Spitzer
A.J.,
Tian
Q.,
Choudhary
R.K.,
Zhao
F.Q.,
Bacterial endotoxin induces oxidative stress and reduces milk protein expression and hypoxia in the mouse mammary gland. Oxidative Medicine and Cellular Longevity.
2020;
2020
:
3894309
.
View Article PubMed Google Scholar -
Kinsner
A.,
Pilotto
V.,
Deininger
S.,
Brown
G.C.,
Coecke
S.,
Hartung
T.,
Inflammatory neurodegeneration induced by lipoteichoic acid from Staphylococcus aureus is mediated by glia activation, nitrosative and oxidative stress, and caspase activation. Journal of Neurochemistry.
2005;
95
(4)
:
1132-43
.
View Article PubMed Google Scholar -
Gutiérrez-Venegas
G.,
Fernández-Rojas
B.,
Rosas-Martínez
M.,
Sánchez-Carballido
M.A.,
Rutin Prevents LTA Induced Oxidative Changes in H9c2 Cells. Preventive Nutrition and Food Science.
2020;
25
(2)
:
203-11
.
View Article PubMed Google Scholar -
Nair
S.,
Sobotka
K.S.,
Joshi
P.,
Gressens
P.,
Fleiss
B.,
Thornton
C.,
Lipopolysaccharide-induced alteration of mitochondrial morphology induces a metabolic shift in microglia modulating the inflammatory response in vitro and in vivo. Glia.
2019;
67
(6)
:
1047-61
.
View Article PubMed Google Scholar -
Liu
Z.,
Xie
L.,
Bian
T.,
Qi
G.,
Wang
Z.,
(3R)-5,6,7-trihydroxy-3-isopropyl-3-methylisochroman-1-one reduces lipoteichoic acid-induced damage in rat cardiomyoblast cells. The Anatolian Journal of Cardiology.
2018;
19
(3)
:
198-204
.
View Article PubMed Google Scholar -
Schilling
J.D.,
Machkovech
H.M.,
He
L.,
Diwan
A.,
Schaffer
J.E.,
TLR4 activation under lipotoxic conditions leads to synergistic macrophage cell death through a TRIF-dependent pathway. Journal of Immunology (Baltimore, Md.: 1950).
2013;
190
(3)
:
1285-96
.
View Article PubMed Google Scholar -
Aits
S.,
Jäättelä
M.,
Lysosomal cell death at a glance. Journal of Cell Science.
2013;
126
(Pt 9)
:
1905-12
.
View Article PubMed Google Scholar -
Klein
J.B.,
Buridi
A.,
Coxon
P.Y.,
Rane
M.J.,
Manning
T.,
Kettritz
R.,
Role of extracellular signal-regulated kinase and phosphatidylinositol-3 kinase in chemoattractant and LPS delay of constitutive neutrophil apoptosis. Cellular Signalling.
2001;
13
(5)
:
335-43
.
View Article PubMed Google Scholar -
Wu
H.H.,
Hsieh
W.S.,
Yang
Y.Y.,
Tsai
M.C.,
Lipoteichoic acid induces prostaglandin E(2) release and cyclooxygenase-2 synthesis in rat cortical neuronal cells: involvement of PKCepsilon and ERK activation. Life Sciences.
2006;
79
(3)
:
272-80
.
View Article PubMed Google Scholar -
Bagaev
A.V.,
Garaeva
A.Y.,
Lebedeva
E.S.,
Pichugin
A.V.,
Ataullakhanov
R.I.,
Ataullakhanov
F.I.,
Elevated pre-activation basal level of nuclear NF-κB in native macrophages accelerates LPS-induced translocation of cytosolic NF-κB into the cell nucleus. Scientific Reports.
2019;
9
(1)
:
4563
.
View Article PubMed Google Scholar -
Zhang
F.X.,
Kirschning
C.J.,
Mancinelli
R.,
Xu
X.P.,
Jin
Y.,
Faure
E.,
Bacterial lipopolysaccharide activates nuclear factor-kappaB through interleukin-1 signaling mediators in cultured human dermal endothelial cells and mononuclear phagocytes. The Journal of Biological Chemistry.
1999;
274
(12)
:
7611-4
.
View Article PubMed Google Scholar -
Kuo
C.T.,
Chiang
L.L.,
Lee
C.N.,
Yu
M.C.,
Bai
K.J.,
Lee
H.M.,
Induction of nitric oxide synthase in RAW 264.7 macrophages by lipoteichoic acid from Staphylococcus aureus: involvement of protein kinase C- and nuclear factor-kB-dependent mechanisms. Journal of Biomedical Science.
2003;
10
(1)
:
136-45
.
View Article PubMed Google Scholar -
Dessing
M.C.,
Schouten
M.,
Draing
C.,
Levi
M.,
von Aulock
S.,
van der Poll
T.,
Role played by Toll-like receptors 2 and 4 in lipoteichoic acid-induced lung inflammation and coagulation. The Journal of Infectious Diseases.
2008;
197
(2)
:
245-52
.
View Article PubMed Google Scholar -
Kao
S.J.,
Lei
H.C.,
Kuo
C.T.,
Chang
M.S.,
Chen
B.C.,
Chang
Y.C.,
Lipoteichoic acid induces nuclear factor-kappaB activation and nitric oxide synthase expression via phosphatidylinositol 3-kinase, Akt, and p38 MAPK in RAW 264.7 macrophages. Immunology.
2005;
115
(3)
:
366-74
.
View Article PubMed Google Scholar -
Britt
R.D.,
Locy
M.L.,
Tipple
T.E.,
Nelin
L.D.,
Rogers
L.K.,
Lipopolysaccharide-induced cyclooxygenase-2 expression in mouse transformed Clara cells. Cellular Physiology and Biochemistry.
2012;
29
(1-2)
:
213-22
.
View Article PubMed Google Scholar -
Eliopoulos
A.G.,
Dumitru
C.D.,
Wang
C.C.,
Cho
J.,
Tsichlis
P.N.,
Induction of COX-2 by LPS in macrophages is regulated by Tpl2-dependent CREB activation signals. The EMBO Journal.
2002;
21
(18)
:
4831-40
.
View Article PubMed Google Scholar -
McElroy
S.J.,
Hobbs
S.,
Kallen
M.,
Tejera
N.,
Rosen
M.J.,
Grishin
A.,
Transactivation of EGFR by LPS induces COX-2 expression in enterocytes. PLoS One.
2012;
7
(5)
:
e38373
.
View Article PubMed Google Scholar -
Nagano
S.,
Otsuka
T.,
Niiro
H.,
Yamaoka
K.,
Arinobu
Y.,
Ogami
E.,
Molecular mechanisms of lipopolysaccharide-induced cyclooxygenase-2 expression in human neutrophils: involvement of the mitogen-activated protein kinase pathway and regulation by anti-inflammatory cytokines. International Immunology.
2002;
14
(7)
:
733-40
.
View Article PubMed Google Scholar -
Wu
H.H.,
Hsieh
W.S.,
Yang
Y.Y.,
Tsai
M.C.,
Lipoteichoic acid induces prostaglandin E(2) release and cyclooxygenase-2 synthesis in rat cortical neuronal cells: involvement of PKCepsilon and ERK activation. Life Sciences.
2006;
79
(3)
:
272-80
.
View Article PubMed Google Scholar -
Lee
I.T.,
Lee
C.W.,
Tung
W.H.,
Wang
S.W.,
Lin
C.C.,
Shu
J.C.,
Cooperation of TLR2 with MyD88, PI3K, and Rac1 in lipoteichoic acid-induced cPLA2/COX-2-dependent airway inflammatory responses. American Journal of Pathology.
2010;
176
(4)
:
1671-84
.
View Article PubMed Google Scholar
Comments
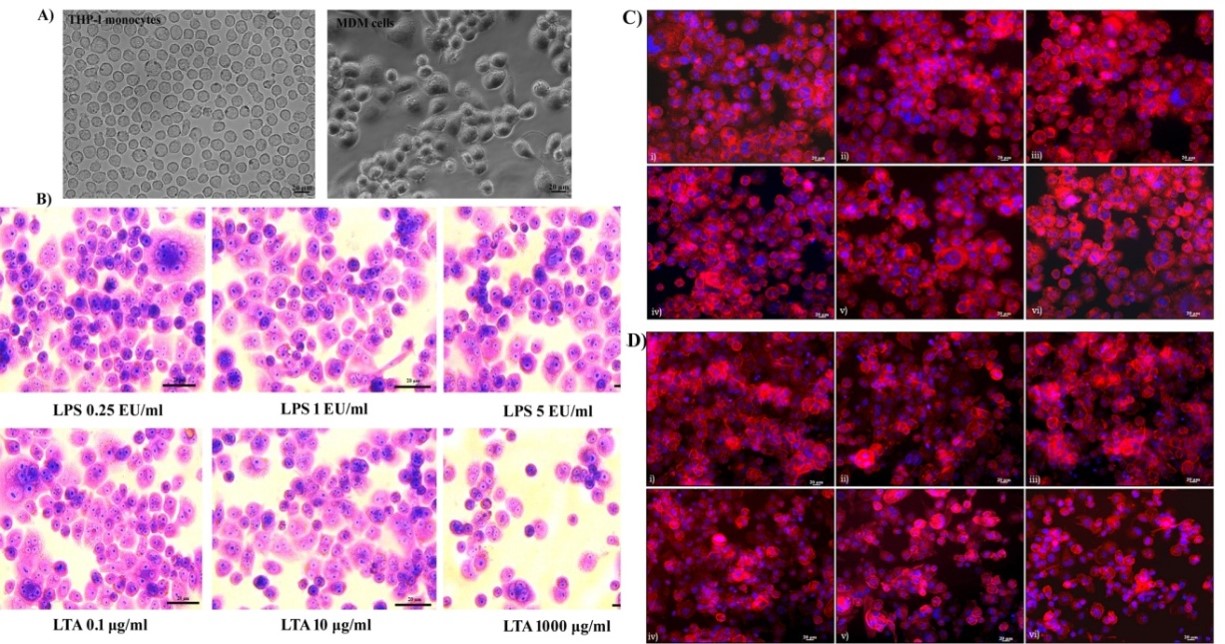
Article Details
Volume & Issue : Vol 8 No 9 (2021)
Page No.: 4562-4582
Published on: 2021-09-30
Citations
Copyrights & License
This work is licensed under a Creative Commons Attribution 4.0 International License.
Search Panel
- HTML viewed - 11847 times
- PDF downloaded - 2480 times
- XML downloaded - 0 times
