


Onion Peel Quercetin Attenuates Ethanol-Induced Liver Injury in Mice by Preventing Oxidative Stress and Steatosis
- Department of Human Anatomy, University of Maiduguri, Nigeria
- Department of Human Anatomy, Rivers State University Port Harcourt, Nigeria
Abstract
Introduction: Alcoholic liver disease (ALD) is a histological abnormality of the liver that ranges from steatosis to fibrosis/cirrhosis. This study examines the role of onion peel quercetin (OPQ) on oxidative stress, liver function and steatosis in ethanol-treated mice over two phases, protective and therapeutic.
Methods: In each phase, 25 mice were divided equally among five groups (n = 5). In both phases, groups 1 and 2 received vehicle and ethanol, respectively, for 8 days. In the protective phase, groups 3 - 5 received 50 mg/kg OPQ, 100 mg/kg OPQ and 100 mg/kg silymarin, followed by ethanol for 8 days. Mice in these groups were euthanized on day 9. In the therapeutic phase, groups 3 - 5 received ethanol for 8 days and were then treated with 50 mg/kg OPQ, 100 mg/kg OPQ and 100 mg/kg silymarin for an additional 8 days before being euthanized on day 17.
Results: Significant decreases in ALT, AST, and ALP serum levels were observed in mice that received OPQ and silymarin compared to mice that received ethanol (P < 0.05). The catalase activity of mice treated with 50 mg/kg OPQ was significantly higher than in controls (P < 0.05). OPQ treatment significantly improved MDA levels relative to controls (P < 0.05). Hepatocyte degeneration, steatosis, and increased lipid peroxidation were observed in ethanol-treated mice. OPQ significantly decreased ALP, ALT, and AST serum levels compared with ethanol treatment (P < 0.05).
Conclusion: Therefore, OPQ can be used as an antioxidant to delay the onset and progression of liver disease by preventing lipid peroxidation, regulating liver function, and promoting albumin synthesis.
Introduction
Alcoholic liver disease (ALD) is a histological abnormality of the liver that ranges from steatosis to fibrosis/cirrhosis1. ALD is often histologically classified into 3 stages: steatosis, hepatitis, and fibrosis/cirrhosis1. Over 90% of individuals who drink more than 60 g of alcohol per day develop macrovesicular steatosis, which can be reversible with complete abstinence or progress to steatohepatitis with continued alcohol consumption, eventually leading to cirrhosis2. Alcohol consumption contributes to the severity of many diseases, including liver, gastrointestinal cancer, neuropsychiatric, and cardiovascular3. Acute liver failure results in multiple organ system dysfunctions, and symptoms may include fatigue, malaise, anorexia, fever, and jaundice4. Potential causes of acute liver failure include hepatitis A, B, and E infections, common in Africa and Asia, or exposure to toxins, alcohol, and acetaminophen, common in America and Europe4. Alcohol consumption accounts for approximately 3.6% of all global deaths and 4.6% of global disability-adjusted life-years and is the third-largest risk factor for disease and disability worldwide5. With the increase in disease, disability, and global death rates due to alcohol consumption, approaches are needed to prevent and treat alcohol-related diseases.
Onions are considered the most abundant source of flavonoids, and their medicinal properties are due to their high organosulfur compound and flavonoid contents6. More than 450,000 tonnes of onion waste are produced annually in America and Europe7, consisting of outer fleshy scales, damaged bulbs, and onion peels that are unsuitable for land disposal due to the rapid growth of phytopathogens8. Quercetin is the most abundant flavonoid, an important antioxidant that is widely distributed throughout the plant kingdom9. Its primary sources include fruits and vegetables, such as apples, garlic, onions, brassica vegetables, shallots, and tomatoes. It is a good metal chelator and free radical scavenger, and previous studies have reported that quercetin has anti-inflammatory and gastroprotective effects and hepatoprotective and antioxidant properties10.
Quercetin can be extracted from onion waste for medicinal uses that leverage the numerous health benefits of the bioactive compounds it contains, avoiding the cost and health hazards associated with its disposal8. Therefore, this study uses quercetin extracted from onion peel (OPQ) to evaluate its protective and therapeutic effects on oxidative stress, liver function, and liver histology in ethanol-treated mice.
Methods
Drugs and chemicals
Quercetin standard, phosphate buffer, sodium carbonate buffer, potassium phosphate, trichloroacetic acid, thiobarbituric acid, hydrogen peroxide, and adrenaline were purchased from Sigma-Aldrich (St. Louis, MO, USA). Ethanol, xylene, formic acid, acetic acid, Sudan black, eosin Y, hematoxylin, and paraffin wax were purchased from BDH Chemical Ltd. (Poole, UK). Alanine aminotransferase (ALT), aspartate aminotransferase (AST), alkaline phosphatase (ALP), and albumin kits were purchased from Randox Biosciences (Crumlin, UK). Other drugs and chemicals used included silica gel precoated TLC plates (Darmstadt, Germany), ketamine (Biosynth AG; St. Gallen, Switzerland), silymarin, and ethyl acetate (Guangdong Guanghua Chemical Factory Co Ltd; Shantou, China).
Quercetin extraction
Quercetin was extracted from onion peel according to a previously described method11. Powdered onion peel with a particle size < 0.2 mm was dissolved in cold ethyl acetate at a ratio of 1 g onion peel to 20 ml ethyl acetate for 24 hours and then shaken for 30 minutes with an orbital shaker. The solution was filtered, and the solvent evaporated in an oven at 40°C. This process was repeated using the filtrate until thin layer chromatography (TLC) indicated a single spot for the OPQ that corresponds with the standard quercetin.
OPQ standardization using TLC
Both OPQ and standard quercetin were dissolved in methanol and spotted on an activated TLC plate (10 x 10 cm) using thin capillary pipettes 1.5 cm above the edge. The plate was developed in an airtight glass tank using ethyl acetate, acetic acid, formic acid, and water (100:11:11:26 v/v) as the mobile phase for 30 minutes. The developed plate was air-dried, and the spots for OPQ and standard quercetin were compared.
Ethical approval
The study was approved by the Department of Human Anatomy Ethical committee at the University of Maiduguri (Maiduguri, Nigeria; UM/HA/PGR18.19-09900) and performed according to the animal research: reporting of experiments (ARRIVE) guidelines. Animal sacrifice and surgical techniques were performed under ketamine anesthesia, and efforts were made to minimize suffering.
Protective phase of onion peel quercetin andethanol administration in mice (n = 5)
|
Groups |
Treatment |
Number of Days |
|---|---|---|
|
1 |
5 ml/kg of tween 80 in distilled water |
8 |
|
2 |
5 ml/kg of 50% ethanol |
8 |
|
3 |
50 mg/kg of onion peel quercetin + 5 ml/kg of 50% ethanol |
8 |
|
4 |
100 mg/kg of onion peel quercetin + 5 ml/kg of 50% ethanol |
8 |
|
5 |
100 mg/kg of Silymarin + 5 ml/kg of 50% ethanol |
8 |
Therapeutic phase of onion peel quercetin and ethanol administration in mice (n = 5)
|
Groups |
Pre-treatment (8 days) |
Post-treatment (8 days) |
|---|---|---|
|
1 |
5 ml/kg tween 80 in distilled water |
Nil |
|
2 |
5 ml/kg of 50% ethanol |
Nil |
|
3 |
5 ml/kg of 50% ethanol |
50 mg/kg of onion peel quercetin |
|
4 |
5 ml/kg of 50% ethanol |
100 mg/kg of onion peel quercetin |
|
5 |
5 ml/kg of 50% ethanol |
100 mg/kg of Silymarin |
Experimental design
This study used 50 BALB/c strain mice (23 - 28 g) provided with free access to grower mash (Grand Cereal; Jos, Nigeria) and water and was performed in two phases. In phase 1, the protective phase, 25 mice were divided equally into five groups (n = 5). Group 1 was the healthy control and received Tween 80 (vehicle) in distilled water at 5 ml/kg for 8 consecutive days. Group 2 was the negative control and received 5 ml/kg of 50% ethanol for 8 consecutive days. Groups 3 and 4 received OPQ at 50 mg/kg and 100 mg/kg, respectively, followed 3 hours later by 5 ml/kg of 50% ethanol for 8 consecutive days. Group 5 received silymarin at 100 mg/kg, followed 3 hours later by 5 ml/kg of 50% ethanol for 8 consecutive days (
In phase 2, the therapeutic phase, another 25 mice were divided equally into five groups (n = 5). Group 1 was the healthy control and received Tween 80 (vehicle) in distilled water at 5 ml/kg for 8 consecutive days. Group 2 was the negative control and received 5 ml/kg of 50% ethanol for 8 consecutive days. Groups 3 and 4 received 5 ml/kg of 50% ethanol for 8 consecutive days, followed by 50 mg/kg and 100 mg/kg of OPQ, respectively, for another 8 days. Group 5 received 5 ml/kg of 50% ethanol for 8 consecutive days, followed by 100 mg/kg of silymarin for another 8 days (
All administration was through the oral route. All mice in phase 1 were sacrificed on day 9, while all mice in phase 2 were sacrificed on day 17. Blood samples were collected in a plain bottle and centrifuged, and serum was collected. The liver was removed and divided into two portions for light microscopy and homogenization. The OPQ and silymarin doses were selected based on previous studies12, 13. Silymarin was selected as the standard drug because it has been used globally for the treatment and prevention of liver disorders for centuries14.
Biochemical analysis
Serum levels of ALT, AST, ALP, and albumin were determined spectrophotometrically using their respective reagent kits following the manufacturer’s instructions. The total protein concentration was measured using the Bradford method as described previously15.
Oxidative stress markers
Part of each liver was homogenized in phosphate buffer (pH 7.2) and centrifuged, and the activities of catalase, glutathione reductase (GSH), superoxide dismutase (SOD), and malondialdehyde (MDA) in the supernatant were measured. Catalase activity was measured using a previously described method16. Briefly, 10 µL of liver homogenate was added to 2.8 mL potassium phosphate buffer (pH 7.0). Then 0.1 mL of freshly prepared hydrogen peroxide was added, and its decomposition rate was measured for 5 minutes using a spectrophotometer at 240 nm. A molar extinction coefficient (E) of 0.041 mM cm was used to calculate the catalase activity as absorbance of the sample divided by E, multiplied by the protein concentration (mg/ml). One unit represents the amount of catalase that decomposes 1 µmol of hydrogen peroxide per min at pH 7.0.GSH activity was determined as described previously17. Briefly, 1.5 mL of 10% trichloroacetic acid was added to 150 µl of the tissue homogenate and centrifuged at 1500 rpm for 5 minutes. Then, 1 mL of the supernatant was treated with 0.5 mL Ellman’s reagent and 3 mL of 0.2 M phosphate buffer (pH 8.0). The absorbance was read at 412 nm, and GSH activity was calculated from the graph of the GSH standard curve.
SOD activity was determined using a previously described method18. Briefly, 0.1 mL of tissue homogenate was diluted in 0.9 mL of distilled water to form microsomes. Then, 0.2 mL of the microsome was added to 2.5 mL of 0.05 M sodium carbonate buffer, and the reaction was initiated by adding 0.3 mL of 0.3 mM adrenaline (pH 10.2). The absorbance was read at 480 nm, and SOD activity was calculated as: absorbance per minute = (A2 — A1) / 2.5% inhibition = 100 — {(increase in absorbance of sample / increase in absorbance of blank) × 100}, where A1 is the absorbance at 30 seconds, and A2 is the absorbance at 150 seconds. One unit represents the amount of SOD required to elicit 50% inhibition of the oxidation of adrenaline to adrenochrome in 1 minute.
The malondialdehyde level was measured as described previously19. Lipid peroxidation, evidence of thiobarbituric acid reactive substance (TBAR) formation, was estimated as follows. First, 150 µl of the tissue homogenate was treated with 2 mL of a working solution containing thiobarbituric acid, trichloroacetic acid, and hydrochloric acid (1:1:1 ratio) and placed in a water bath at 90°C for 60 minutes. Then, the mixture was cooled and centrifuged at 3000 rpm for 5 minutes, and the absorbance of the pink supernatant was measured at 535 nm. The malondialdehyde formed was then calculated using the Molar extinction coefficient of 1.56 × 10cmM with the equation: TBAR concentration (nmol/mg protein) = absorbance of sample / 1.56 × 10 × protein concentration.
Histology
Part of each liver was fixed in formalin, dehydrated in a graded series of alcohol, cleared in xylene, and embedded in paraffin wax. Paraffin sections were cut at 5 µm thickness and stained with hematoxylin and eosin (H&E). Briefly, tissue sections were stained with Harris hematoxylin for 3 minutes, rinsed in hydrochloric acid, and differentiated in running water for 3 minutes. They were then stained with aqueous eosin Y solution for 3 minutes, rinsed in running water, dehydrated in ethanol, and cleared in xylene. The other liver parts were frozen, sectioned with a cryostat (Leica CM1850; Morrisville, NC, USA), and stained with Sudan black. Briefly, sections were treated with 85% propylene glycol for 5 minutes and stained with Sudan black for 7 minutes. They were then rinsed in 85% propylene glycol and distilled water for 3 minutes each and allowed to dry. All slides were mounted in DPX, and micrographs were taken at ×200 magnifications using a digital microscope camera (AmScope; Dorchester, UK).
Statistical analysis
One-way analysis of variance (ANOVA) with Sidak post hoc tests was performed using GraphPad Prism 7 (GraphPad Software; San Diego, CA, USA). The results are presented as the mean ± standard error of the mean (SEM), and those with p < 0.05 were considered statistically significant.
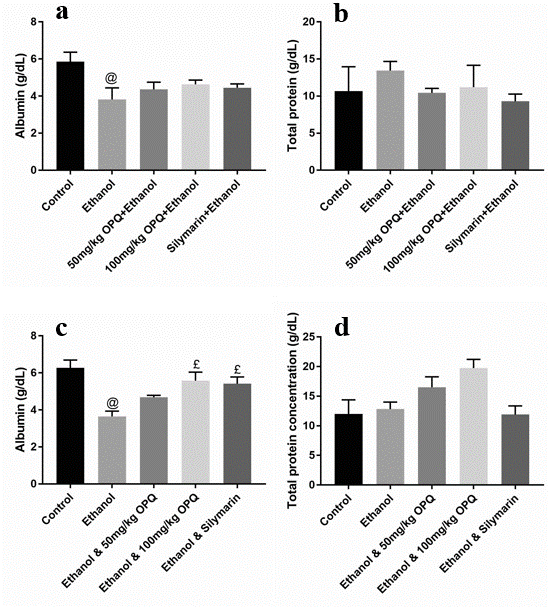
Graph showing albumin and total protein concentration of OPQ and ethanol treated mice. (Graphs a & b are the protective phases while graphs c & d are the therapeutic phases). Values are presented as Mean ± SEM, @ and £ implies significant difference with control and ethanol treated mice respectively. SEM = standard error of mean, OPQ = onion peel quercetin, n = 3
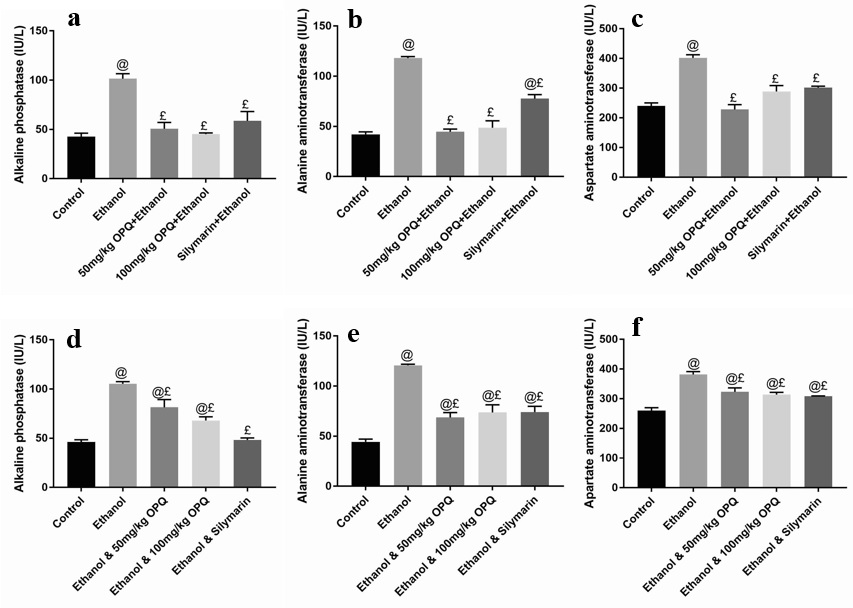
Graph showing the liver function of OPQ and ethanol treated mice. (Graphs a-c are the protective phases while graphs d-f are the therapeutic phases). Values are presented as Mean ± SEM, @ and £ implies significant difference with control and ethanol treated mice respectively. SEM = standard error of mean, OPQ = onion peel quercetin, n = 3

Graph showing oxidative stress biomarkers in the liver homogenate of OPQ and ethanol treated mice. (Graphs a-d are the protective phases while graphs e-h are the therapeutic phases). Values are presented as Mean ± SEM, @ and £ implies significant difference with control and ethanol treated mice respectively. SEM = standard error of mean, OPQ = onion peel quercetin, n = 3

Photomicrographs of the liver in OPQ and ethanol treated mice (protective phase) showing hepatocytes (yellow arrows), central vein (blue arrows), sinusoids (black arrows), vacuoles (white arrows) and pyknosis (green arrows). a = control, b = ethanol, c = 50mg/kg OPQ plus ethanol, d = 100mg/kg OPQ plus ethanol, e = silymarin plus ethanol. H&E stain, x200 magnification

Photomicrographs of the liver in OPQ and ethanol treated mice (protective phase) showing fat droplet (yellow arrows). a = control, b = ethanol, c = 50mg/kg OPQ plus ethanol. d = 100mg/kg OPQ plus ethanol, e = silymarin plus ethanol. Sudan black stain, x200 magnification

Photomicrographs of the liver in OPQ and ethanol treated mice (therapeutic phase) showing hepatocytes (yellow arrows), central vein (blue arrows), sinusoids (black arrows) and pyknosis (green arrows). a = control, b = ethanol, c = ethanol plus 50mg/kg OPQ, d = ethanol plus 100 mg/kg OPQ e = ethanol plus silymarin. H&E stain, x200 magnification
Results
Serum biochemical parameters
Protective phase
Albumin and total protein concentration levels were not significantly different (p > 0.05) in mice pretreated with 50 mg/kg OPQ (4.37 ± 0.38 and 10.44 ± 0.59, respectively), 100 mg/kg OPQ (4.64 ± 0.23 and 11.21 ± 2.96), and silymarin (4.45 ± 0.20 and 9.30 ± 0.97) than in control mice (5.86 ± 0.51 and 10.67 ± 3.29). However, albumin levels were significantly lower (p < 0.05) in ethanol pretreated mice (3.82 ± 0.62) than in control mice (5.86 ± 0.51; Figure 1a-b). In addition, serum ALP, ALT, and AST levels were significantly lower (p < 0.05) in mice that received 50 mg/kg OPQ (50.70 ± 6.40, 44.67 ± 2.60, and 228.00 ± 16.46, respectively) and 100 mg/kg OPQ (45.2 ± 1.21, 48.67 ± 6.89, and 288.70 ± 19.75) than in ethanol-treated mice (101.50 ± 5.07, 118.00 ± 1.53, and 402.00 ± 10.12). Conversely, serum ALP, ALT, and AST levels in mice pretreated with 50 mg/kg OPQ (50.70 ± 6.40, 44.67 ± 2.60, and 228.00 ± 16.46, respectively) and 100 mg/kg OPQ (45.2 ± 1.21, 48.67 ± 6.89, and 288.70 ± 19.75) were not significantly different (p > 0.05) than in control mice (42.67 ± 3.51, 42.00 ± 2.51, and 240.00 ± 10.41; Figure 2a-c).
Therapeutic phase
A significant reduction in albumin levels (p < 0.05) was observed in ethanol-treated mice (3.65 ± 0.29) compared to control mice (6.28 ± 0.42). However, albumin levels were not significantly different (p > 0.05) in mice treated with 50 mg/kg OPQ (4.68 ± 0.10), 100 mg/kg OPQ (5.58 ± 0.46), and silymarin (5.42 ± 0.37) than in control mice (6.28 ± 0.42; Figure 1c). In addition, total protein concentration did not differ significantly (p > 0.05) in any treatment group compared to the control group (Figure 1d). Serum ALP, ALT, and AST levels were significantly increased (p < 0.05) in ethanol-treated mice (105.30 ± 2.32, 120.00 ± 1.20, and 382.00 ± 9.60, respectively) compared to control mice (46.20 ± 2.19, 44.33 ± 2.67, and 256.70 ± 10.09). Similarly, serum ALP, ALT, and AST levels were significantly higher (p < 0.05) in mice treated with 50 mg/kg OPQ (81.40 ± 7.93, 68.67 ± 4.91, and 323.30 ± 13.33, respectively) and 100 mg/kg OPQ (68.03 ± 3.37, 73.67 ± 7.66, and 314.00 ± 7.37) than in control mice (46.20 ± 2.19, 44.33 ± 2.67, and 256.70 ± 10.09; Figure 2d-f).
Oxidative stress biomarkers
Protective phase
Catalase activity was significantly decreased (p < 0.05) in ethanol-treated mice (28.53 ± 1.23) compared to control mice (52.03 ± 2.82). However, it was significantly higher (p < 0.05) in mice pretreated with 50 mg/kg OPQ (74.87 ± 5.29) than in control mice (52.03 ± 2.82). The activities of GSH and SOD did not differ significantly (p > 0.05) in any treatment group compared to the control group.
The MDA level of ethanol-treated mice (34.27 ± 1.10) was significantly increased (p<0.05) relative to control mice (22.87 ± 1.68). However, pretreatment with 50 mg/kg OPQ (19.17 ± 1.10) and 100 mg/kg OPQ (28.20 ± 0.95) significantly reduced (p < 0.05) MDA levels relative to ethanol treatment (34.27 ± 1.10; Figure 3a-d).
Therapeutic phase
Mice treated with 50 mg/kg OPQ had significantly higher (p < 0.05) catalase activity (87.17 ± 6.03) compared to control (55.07 ± 2.53) and ethanol-treated (45.13 ± 6.83) mice. GSH and SOD activities were significantly increased (p < 0.05) in mice treated with 100 mg/kg OPQ mice (75.87 ± 6.25 and 25.90 ± 1.67, respectively) compared to control (57.97 ± 1.07 and 19.93 ± 0.23) and ethanol-treated (46.30 ± 3.60 and 20.10 ± 0.35) mice. Treatment with 50 mg/kg OPQ (24.60 ± 1.16) and 100 mg/kg OPQ (34.67 ± 1.02) significantly reduced (p < 0.05) MDA levels compared to ethanol-treated mice (46.60 ± 0.95; Figure 3e-h).
Histological study
Protective phase
Photomicrographs of the livers of control mice showed normal hepatocytes, sinusoids, and central veins (Figure 4a). The livers of mice that received 50% ethanol at 5 ml/kg for 8 days showed round spaces around hepatocytes, pyknotic nuclei, and normal central veins (Figure 4b). The livers of mice that received 50 mg/kg and 100 mg/kg OPQ and 50% ethanol for 8 days showed normal hepatocytes, sinusoids, and central veins (Figure 4c-d). The livers of mice that received 100 mg/kg of silymarin and 50% ethanol showed degenerating hepatocytes, sinusoids, and normal central veins (Figure 4e). Sudan black staining of the protective group showed fat deposits in the livers of mice that received 50% ethanol (Figure 5b). Fat deposits were not observed in the livers of control mice, mice that received 50 mg/kg and 100 mg/kg OPQ and 50% ethanol, and mice that received 100 mg/kg silymarin and 50% ethanol (Figure 5a and c-e).
Therapeutic phase
Photomicrographs of the livers of control mice showed normal hepatocytes, sinusoids, and central veins (Figure 6a). Photomicrographs of the livers of mice that received 50% ethanol at 5 ml/kg for 8 days and left untreated for an additional 8 days showed normal central veins with degenerating hepatocytes and enlarged sinusoids (Figure 6b). The livers of mice that received 50% ethanol at 5 ml/kg for 8 days and treated with 50 mg/kg of OPQ for an additional 8 days showed normal central veins and degenerating hepatocytes (Figure 6c). The livers of mice that received 50% ethanol at 5 ml/kg for 8 days and treated with 100 mg/kg of OPQ for an additional 8 days showed normal central veins and degenerating hepatocytes with numerous pyknotic nuclei (Figure 3d). The livers of mice that received 50% ethanol at 5 ml/kg for 8 days and treated with 100 mg/kg of silymarin for an additional 8 days showed normal central veins with degenerating hepatocytes (Figure 6e).
Discussion
This study has shown that OPQ treatment prevents liver injury and oxidative stress in ethanol-treated mice and enhances antioxidant activity, regulate liver function, and albumin synthesis. These findings indicate that OPQ can be used as an antioxidant to prevent and treat liver disease.
Low serum albumin is associated with adverse effects in critical illness20. An earlier study reported that low serum albumin levels in patients on admission are associated with a high mortality rate and that stabilizing albumin levels to normal before discharge is associated with a low mortality risk21. Silymarin was reported to inhibit tumor necrosis factor-alpha expression and protect liver cells22. This study found a decline in serum albumin in ethanol-treated mice and a significant elevation after OPQ and silymarin treatment. This finding suggests that ethanol consumption can cause liver injury and reduces albumin synthesis. In addition, it indicates that OPQ improves albumin synthesis by preventing hepatocyte damage and improving its function.
We performed a liver function study to evaluate the protective and therapeutic roles of OPQ in ethanol-treated rats, finding that OPQ can regulate liver function by preventing the initiation and progression of ethanol-induced liver disease. Serum ALT and AST have been reported to increase 24 hours after alcohol consumption23. A previous study revealed that quercetin attenuates serum ALT and AST levels and steatosis caused by chronic and binge ethanol consumption in mice24. In addition, other studies have shown that quercetin supplementation attenuates bile duct ligation (BDL)-induced liver injury in rats by significantly reducing serum ALT and AST levels and preventing fibrosis25.
Furthermore, a previous study reported that quercetin could prevent liver tissue injury by reducing the expression of transforming growth factor-β1 and increasing serum albumin production in dimethylnitrosamine-treated rats26. An increase in serum ALP is associated with either liver or kidney disease27, and elevated serum ALT and AST levels are indicators of tissue necrosis28.
While we found pretreatment with OPQ to regulate liver function and prevent liver injury, treatment with OPQ for 8 days after ethanol-induced liver damage did not reverse its effects. This finding suggests that short-term (8-day) OPQ treatment cannot reverse certain stages of liver damage. Consequently, degenerating hepatocytes were observed in the livers of ethanol-treated mice in the therapeutic group.
Serum ALP levels were found to be high in patients with obstructive jaundice and alcoholic liver disease29. Plasma membrane damage and protein leakage are the most common causes of increased serum ALT and AST levels, possibly due to liver injury or disease30. Serum ALT and AST levels are elevated in many conditions, including diabetes, obesity, liver disease, and hypertriglyceridemia31. An increase in serum ALT and AST could result from the effect of toxic substances such as acetaminophen, CCl4, and alcohol on the liver32. The mechanism by which OPQ prevents liver injury and regulates liver function could be maintaining hepatocyte membrane integrity. Therefore, preventing liver injury prevents ALT and AST synthesis.
We performed an oxidative stress study to assess the antioxidant properties of OPQ and its role in preventing disease initiation and progression, finding that ethanol can promote lipid peroxidation leading to decreased antioxidant activity. However, we found OPQ to prevent lipid peroxidation and enhance antioxidant activities. An earlier study also reported that quercetin at 10 mg/kg and 20 mg/kg increased catalase and SOD activity in neonatal rats33. However, the catalase activity levels of mice treated with 100 mg/kg of OPQ and silymarin did not differ significantly (p > 0.05) from the control mice, indicating that 50 mg/kg of OPQ enhances catalase activity to a greater extent than 100 mg/kg of OPQ and silymarin. These findings suggest that one week of OPQ treatment at 100 mg/kg does not significantly improve GSH and SOD levels in mouse livers.
Previous studies reported that quercetin enhances antioxidant activity by regulating GSH and SOD levels34. When free radicals are generated, SOD transforms O2- into HO and catalyzes the decomposition of HO into HO. The whole cascade requires GSH as an Hdonor35. Ethanol significantly decreased (p < 0.05) MDA levels, while OPQ significantly improved them (p < 0.05; Figure 3d). Free radicals generated during oxidative stress trigger lipid peroxidation by oxidizing proteins to an inactive state, leading to DNA and tissue damage36. Quercetin was reported to reduce the viability of MDA-MB-231 cells, reducing lipid peroxidation. Moreover, it inhibits inflammation and oxidative stress by alleviating structural damage to mitochondria37, 38. OPQ may enhance catalase activity by increasing the ability of cells to scavenge free radicals or by improving their antioxidant capacity.
Catalase and SOD are considered the first line of antioxidant defense in response to reactive oxygen species (ROS)39. Catalase deficiency in mice results in susceptibility to tissue injury and renal fibrosis40. Quercetin was reported to attenuate catalase and SOD activities in sodium fluoride-intoxicated rats41. We found catalase activity to be higher in mice treated with 50 mg/kg of OPQ and SOD activity to be higher in mice treated with 100 mg/kg of OPQ. Therefore, these findings indicate that 100 mg/kg of OPQ is more effective than 50 mg/kg. Moreover, the dosage of OPQ for the effective prevention of oxidative stress and oxidative stress-related tissue injury may vary depending on the antioxidant used.Lipid peroxidation is a chain reaction that results in the formation of various active compounds and cellular damage, and MDA levels are an important indicator of it42. This association might be the cause of hepatocyte degeneration and pyknotic nuclei we observed in the livers of mice that received ethanol. A significant increase in MDA levels was reported in sodium fluoride-intoxicated rats, obese patients, patients with severe sepsis, and diabetic rats41. We found MDA levels in mice treated with 50 mg/kg of OPQ to not differ significantly (p > 0.05) from control mice. However, quercetin was reported to significantly reduce MDA activity and increase catalase, SOD, and GSH activities in tert-butyl hydroperoxide (t-BHP)-induced acute liver damage43.We performed a histological study to assess the role of OPQ in preventing and treating liver damage, finding that OPQ prevented steatosis in ethanol-treated mice. However, administration of OPQ for 8 days could not reverse the hepatocyte degeneration induced by ethanol. However, a previous study reported that quercetin alleviates steatosis caused by chronic and binge ethanol consumption in mice32. In addition, it also prevented steatosis in a liver-on-a-chip model44. Ethanol consumption was found to cause lipid droplet accumulation and liver damage in mice45. A 30-day repeated-dose quercetin regimen was reported to have hepatoprotective activity in a high-fat diet-induced nonalcoholic fatty liver disease mouse model46.
This study was limited to the histological, biochemical, and antioxidant effects of OPQ in ethanol-treated mice. We did not study other biomarkers, such as inflammatory markers, protein synthesis, and genes with elevated expression in different forms of liver diseases. Therefore, the exact mechanism through which OPQ exerts its protective role could not be determined, and further studies are required to elucidate it.
Conclusions
This study’s findings suggest that OPQ can be used to prevent ethanol-induced liver injury. Moreover, it could be used as a natural antioxidant to delay the onset and progression of liver disease by preventing lipid peroxidation, regulating liver function, and promoting albumin synthesis.
Abbreviations
ALD: alcoholic liver disease, ALP: alkaline phosphatase, ALT: alanine aminotransferase, AST: aspartate aminotransferase, CAT: catalase, ELISA: enzyme linked immune-sorbet assay, GSH: reduced glutathione, H&E: heamatoxylin and eosin, NAFLD: non-alcoholic fatty liver disease, OPQ: onion peel quercetin, ROS: reactive oxygen species, SEM: standard error of mean, SOD: superoxide dismutase
Acknowledgments
None.
Author’s contributions
All authors designed the research. NID provided study materials and conducted the research. Data were analysed and interpreted by all authors. NID drafted the initial manuscript while SHG & TWJ revised the manuscript critically. Final approval of the manuscript was done by all authors.
Funding
Not applicable.
Availability of data and materials
The datasets used and/or analyzed during the current study are available from the corresponding author on reasonable request.
Ethics approval and consent to participate
The study was approved by the Department of Human Anatomy Ethical committee at the University of Maiduguri (Maiduguri, Nigeria; UM/HA/PGR18.19-09900) and performed according to the animal research: reporting of in vivo experiments (ARRIVE) guidelines.
Consent for publication
Not applicable.
Competing interests
The authors declare that they have no competing interests.