

Copyrights: Somnath Ghosal, Saran Chattopadhyaya, Subrata Banerjee, 2022. License: This work is licensed under a Creative Commons Attribution 4.0 International License.
Abstract
Background: Multiple myeloma (MM), which constitutes 1% of all cancers, remains incurable due to the acquisition of drug resistance. Proteasome inhibitor therapy such as bortezomib (BTZ), one of the key therapies used to treat MM, is impeded by the occurrence of BTZ resistance. The precise mechanism underlying this acquired BTZ resistance in MM is not yet well understood. In recent times, the role of non-coding RNAs, such as microRNAs (miRNAs) and circular RNAs (circRNAs), in cancer progression and drug resistance has been demonstrated. The present study aimed to identify differentially expressed miRNAs (DEmiRs), circRNAs, and target genes in BTZ-resistant MM in silico and in vitro.
Methods: DEmiRs were obtained and analyzed from microarray datasets of MM patients from the Gene Expression Omnibus (GEO) database using GEO2R. Targets of a DEmiR were detected using mirDIP software. Gene ontology and pathway enrichment analysis of the targets were executed using the DAVID database. A protein–protein interaction network of targets was constructed and analyzed using the STRING database and Cytoscape tool. Expression levels of a DEmiR and an interacting circRNA were assessed by qRT-PCR. Target gene expression was assessed by qRT-PCR and western blot.
Results: Among the identified DEmiRs, hsa-mir-151a-3p was found to be upregulated in BTZ-resistant MM. One circRNA, hsa_circ_0000073, that was predicted to interact with hsa-mir-151a-3p using the CircInteractome platform, was downregulated in BTZ-resistant MM. Among the targets of hsa-mir-151a-3p, p53 was downregulated at both the transcript and protein levels in BTZ-resistant MM.
Conclusions: This study indicates that these molecular players could be implicated in BTZ-resistant MM.
Introduction
Multiple myeloma (MM), the second most common form of blood cancer, is an incurable and malignant plasma cell disorder that comprises approximately 10%–13% of all hematological malignancies1. In MM, the malignant plasma cells exhibit the common characteristics of fast clonal proliferation and production of excessive non-functional monoclonal immunoglobulin proteins in the bone marrow microenvironment. These superfluous monoclonal immunoglobulins accumulate in the blood and urine and become the cause of organ dysfunctions and failure. Although several genetic alterations with pivotal roles in the initiation, progression, and pathogenesis of MM have been observed in these malignant plasma cells, the cause of the transformation of plasma cells into malignant cells remains to be understood2. Various clinical features, including bone lesions, anemia, renal insufficiency, and hypercalcemia, are observed in MM patients3. MM typically evolves from a pre-malignant condition, monoclonal gammopathy of undetermined clinical significance (MGUS), that gives rise to smoldering MM and consequentially leading to symptomatic MM. MGUS is observed in 3% – 5% of the population above 50 years of age4. Each year, almost 1% of patients with MGUS develop active MM5. Overall median survival in newly diagnosed MM patients is 2.5 – 3 years, which can be extended to 4–5 years with therapeutic interventions like proteasome inhibitors6. Only 3% of MM patients survive 10 years after diagnosis2.
Among the proteasome inhibitors, bortezomib (BTZ) was the first approved to treat MM. It exerts its cytotoxic actions by inhibiting the β5 and β1 subunits of the constitutive proteasome (c20S) and β5i of the immunoproteasome (i20S) and thus suppressing the progression of MM7. The development of BTZ resistance substantially impedes the treatment of MM. Although several genetic alterations in molecules such as the β5 proteasomal subunit, as well as other factors such as the unfolded protein response, exocytosis of ubiquitinated proteins, and microRNAs (miRNAs) and circular RNAs (circRNAs), have been implicated in BTZ resistance, the precise molecular mechanism(s) driving drug resistance remains less clear.
Several recent studies have identified the role of non-coding RNAs such as miRNAs (miR‐520g, miR‐520h, miR‐30a‐3p) and circRNAs in BTZ resistance in MM8.
In this study, we aimed to identify novel miRNAs that might be crucial in the development of BTZ resistance using in silico bioinformatics analysis. Of the detected miRNAs, the expression of hsa-mir-151a-3p was assessed in BTZ-resistant MM cells. We have also identified differential expression of circRNA, has_circ_0000073, and p53 in BTZ-resistant cells. This study implicates these molecular players in BTZ-resistant MM.
Methods
MicroRNA datasets from multiple myeloma patients
Two miRNA gene expression profiles by microarray (GSE37053 and GSE24371) from MM patients were acquired from the GEO database (https://www.ncbi.nlm.nih.gov/geo/)9, 10, 11. The dataset GSE37053 was generated in the GPL8227 platform (Agilent-019118 Human miRNA Microarray 2.0 G4470B) by performing miRNA profiling of CD138 plasma cells obtained from 39 MM patients and 18 disease controls. GSE24371 was produced in the GPL10385 platform (microRNA spotted oligo array version 17.0) by profiling the miRNAs of CD138 plasma cells purified from 33 MM patients and 9 disease controls. All samples in these two datasets are categorized as either MM or control.
Analysis of differentially expressed miRNAs
Analysis of differentially expressed miRNAs (DEmiRs) was performed using the GEO2R platform (https://www.ncbi.nlm.nih.gov/geo/geo2r /). The GEO2R platform analyzed and presented the DEmiRs between MM patients and disease controls. In the GSE37053 and GSE24371 datasets, miRNAs with a |log2fold change (FC)|≥ 0.4 were identified as significant DEmiRs using limma packages from the Bioconductor project12. Venn diagrams of the DEmiRs of GSE37053 and GSE24371 datasets were drawn using an online tool, Venny 2.1.0 (https://bioin fogp.cnb.csic.es/tools /venny /). Common DEmiRs from these two datasets were selected for further analysis.
Prediction of miRNA target genes
Target genes of selected common DEmiRs were predicted and identified using the bioinformatics prediction software miRNA Data Integration Portal (mirDIP; (http://ophid.utoronto.ca/mirDIP)13. This software can obtain the data from 26 different databases for miRNAs to generate robust data on miRNA target genes.
Analysis of gene ontology and pathway enrichment
Gene ontology (GO) comprises three classes of data: biological processes, molecular functions, and cellular components. GO and Kyoto Encyclopedia of Genes and Genomes (KEGG) pathway enrichment for probing the function of miRNA target genes were analyzed using the Database for Annotation Visualization and Integrated Discovery (DAVID 6.8, https://david.ncifc rf.gov/tools.jsp) and R software14. Terms with P < 0.05 were considered significantly enriched.
Construction of protein–protein interaction network
To examine the connections among the target genes, a protein–protein interaction (PPI) network was constructed using the Search Tool for the Retrieval of Interacting Genes database (STRING version 11.5, http://stringdb.org)15. Cytoscape (version 3.7.2) software was used for the visualization of the PPI network16.
Prediction of interaction between circular RNA and miRNA
Interactions between circRNA and the selected common DEmiR were determined using the web tool Circular RNA Interactome (CircInteractome, https://circinteractome.nia.nih.gov/)17. This computational platform is able to predict and map the interaction sites between circRNA and miRNA.
Cell culture and drug treatment
The human MM cell line RPMI 8226 was procured from the National Centre for Cell Science, India. The BTZ-resistant RPMI 8226/PS100 cell line, which is resistant to 100 nM BTZ and was generated by exposing RPMI 8226 cells to stepwise increasing concentrations of BTZ with a starting concentration of 0.2 nM for approximately 15 months, was donated by Prof. Jacqueline Cloos18. DG75, a non-myeloma B-lymphoblast cell line, was used as a control. All cells were cultured in RPMI 1640 (Gibco) media supplemented with 10% (v/v) heat-inactivated fetal bovine serum (Gibco). BTZ-resistant RPMI 8226/PS100 cells were cultured and treated with 100 nM BTZ (Natco Pharma). Cell lines were maintained at 37°C with 5% CO2.
RNA extraction and quantitative real-time PCR
Total RNA was isolated using RNA-XPress reagent (HiMedia) and the concentration and quality were assessed using a NanoDrop One (Thermo Fisher Scientific). A total of 1.5 μg of total RNA was used for cDNA synthesis using the iScript cDNA Synthesis Kit (Bio-Rad) according to the manufacturer’s protocol (5 min at 25°C, 20 min at 46°C, and 1 min at 95°C). Quantitative RT-PCR was performed using SYBR Green reagent (Bio-Rad) in a CFX-Connect real time system (Bio-Rad). HPRT1 was used as the endogenous control to normalize the expression of genes using the 2- ΔΔCt method. All the samples were run in technical triplicate for 40 cycles of 5 min at 95°C, 10 sec at 95°C, 20 sec at 52°C, and 30 sec at 72°C. The primer sequences used for quantitative RT-PCR analysis in this study were as follows:
Stem-loop primer for hsa-mir-151a-3p:
Western blot analysis
Cells were harvested and lysed with ice-cold radioimmunoprecipitation assay buffer [20 mM Tris-HCl (pH 8.0), 137 mM NaCl, 10% glycerol, 1% Nonidet P-40, 2 mM EDTA, 200 mM Na3VO4, 100 mM phenyl-methyl-sulfonyl fluoride, protease inhibitor cocktail, and phosphatase inhibitor]. Protein concentration was measured using Bradford reagent (Bio-Rad). Equal amounts of protein were loaded and run on sodium dodecyl sulfate–polyacrylamide gel electrophoresis and electro-transferred onto a nitrocellulose membrane (G-Biosciences). The membrane was blocked with 5% non-fat dry milk in TBS containing 0.1% Tween 20 (TBST). Primary antibodies against p53 (Santa Cruz) and β-actin (Cell Signaling Technology) were incubated with membranes at 4°C overnight. After incubation with primary antibody, membranes were washed with TBST and probed with secondary antibodies (anti-mouse and anti-rabbit conjugated to horseradish peroxidase; Cell Signaling Technology). The blots were then developed using enhanced chemiluminescent substrate (Thermo Fisher Scientific).
Statistical analysis
All values are represented as mean ± SEM, and p-values < 0.05 were considered statistically significant. The significance was calculated using a standard Student’s t-test, with * p < 0.05, ** p < 0.01, and *** p < 0.001. The gene expression levels were analyzed with an unpaired two-tailed t-test. All the data were analyzed using GraphPad Prism software (version 5.01).
| Regulation | miRNA Symbol |
|---|---|
| Up-regulated | hsa-miR-222, hsa-miR-221, hsa-miR-188-5p, hsa-miR-96, hsa-miR-29c, hsa-miR-148a, hsa-miR-874, hsa-miR-34c-3p, hsa-miR-151-3p |
| Down-regulated | hsa-miR-142-3p, hsa-miR-26b, hsa-miR-103, hsa-miR-185, hsa-miR-25, hsa-miR-33a, hsa-miR-107 |


Results
Identification of DEmiRs in multiple myeloma patients
The microarray-based gene expression profiles GSE37053 and GSE24371 were analyzed to identify miRNAs that were differentially expressed between MM patients and disease controls. Data normalization of these two datasets was performed to compare the gene expression between MM and control (Figure 1 a,b). miRNAs with |log2FC| ≥ 0.4 and adjusted p < 0.05 were considered DEmiRs. The common DEmiRs from these two datasets consisted of 16 miRNAs. Among these common miRNAs, 9 miRNAs were upregulated and 7 miRNAs were downregulated (Figure 1 c,d; Table 1).
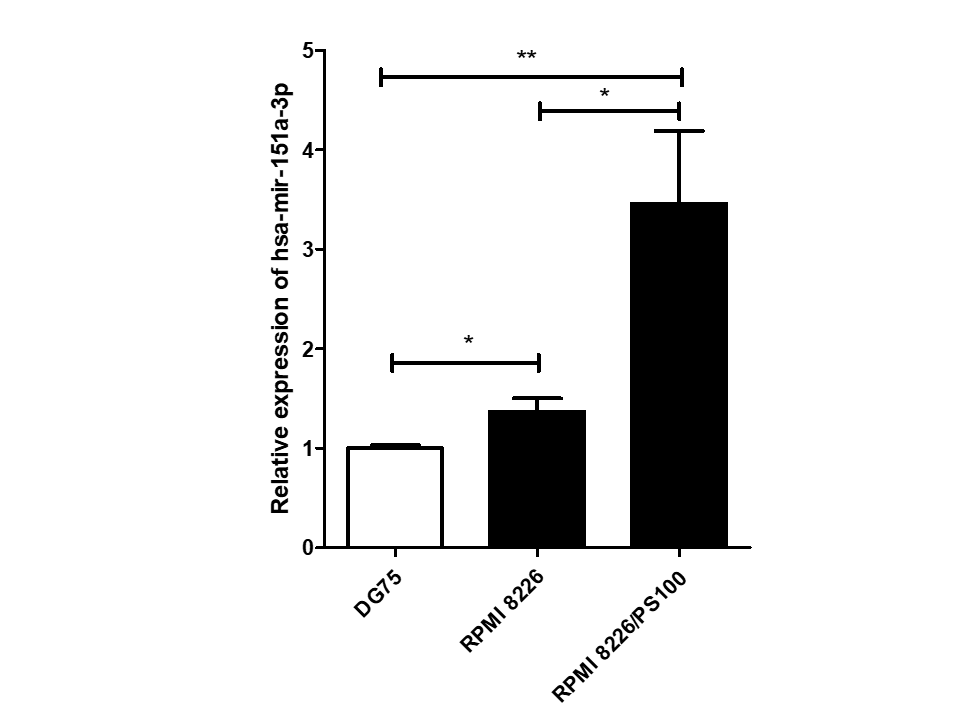
Expression status of the miRNA hsa-mir-151a-3p in a multiple myeloma cell line
Among 16 DEmiRs, one miRNA, hsa-mir-151a-3p, whose role has not yet been examined in MM to our knowledge, was selected for further investigation. hsa-mir-151a-3p was found to be upregulated significantly in both the datasets of MM patients, GSE37053 and GSE24371. Its expression was assessed in the RPMI 8226 MM cell line and BTZ-resistant RPMI 8226/PS100 cells, and it was found to be significantly upregulated in both MM cells and BTZ-resistant MM cells (Figure 2). Therefore, hsa-mir-151a-3p may have a role in the pathogenesis of MM as well as in drug resistance mechanisms.
Prediction and identification of genes targeted by hsa-mir-151a-3p
Analysis with the mirDIP database detected several genes that could be targeted by hsa-mir-151a-3p with very high confidence. A total of 159 genes showing interactions with the miRNA with very high confidence (top 1%) were identified and selected for further analysis (Supplementary File 1).
Gene ontology and pathway enrichment analysis of target genes
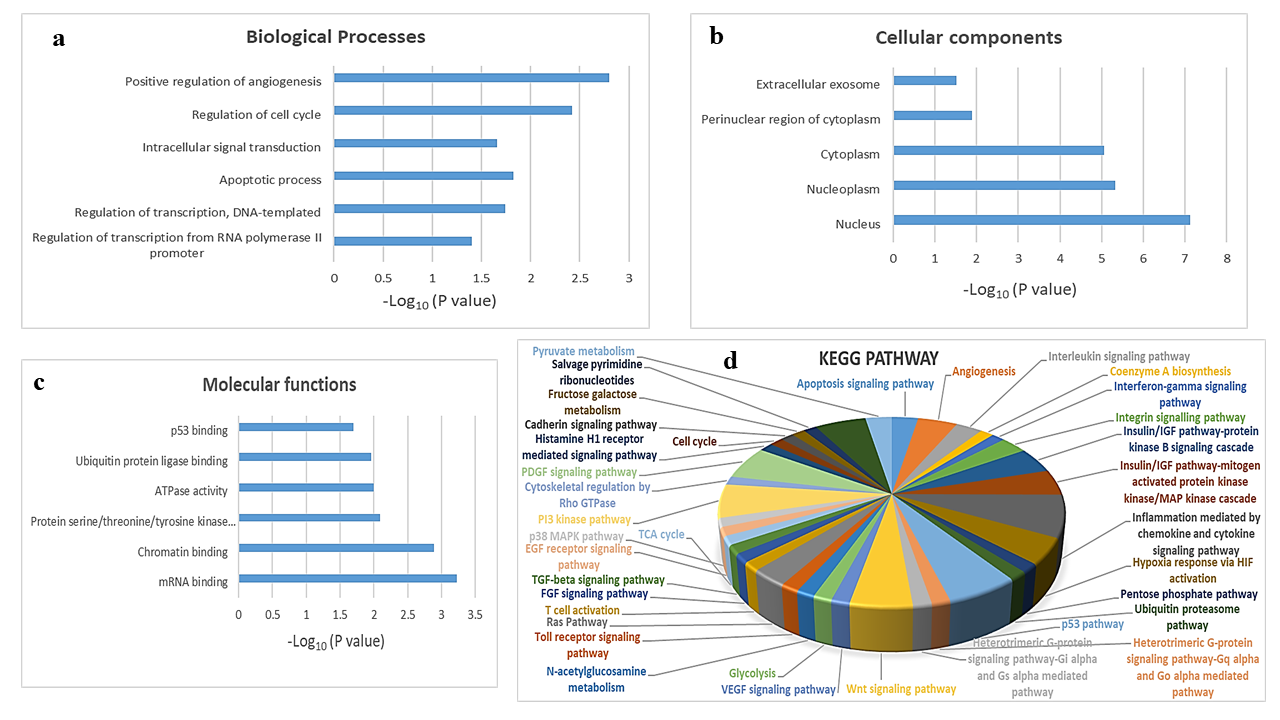
To explore the biological function of target genes of hsa-mir-151a-3p, GO and KEGG pathway enrichment analysis were performed. The top GO terms were determined based on the counts of the genes from the DAVID database (version 6.8). GO analysis revealed that the target genes were enriched in the biological processes positive regulation of angiogenesis, regulation of cell cycle, intracellular signal transduction, apoptotic process, regulation of transcription, DNA-templated, and regulation of transcription from RNA polymerase II promoter (Figure 3 a); the cellular components extracellular exosome, perinuclear region of cytoplasm, cytoplasm, nucleoplasm, and nucleus (Figure 3 b); and the molecular functions p53 binding, ubiquitin protein ligase binding, ATPase activity, protein serine/threonine/tyrosine kinase activity, chromatin binding, and mRNA binding (Figure 3 c). KEGG analysis showed that the most significantly enriched pathways were the inflammation mediated by chemokine and cytokine signaling pathway, the p53 pathway, the PI3 kinase pathway, the PDGF signaling pathway, the Wnt signaling pathway, angiogenesis, the insulin/IGF pathway-protein kinase B signaling cascade, the MAPK cascade, hypoxia response via HIF activation, the apoptosis signaling pathway, the interleukin signaling pathway, the integrin signaling pathway, and the Ras pathway (Figure 3 d).
Protein–protein interaction network of target genes
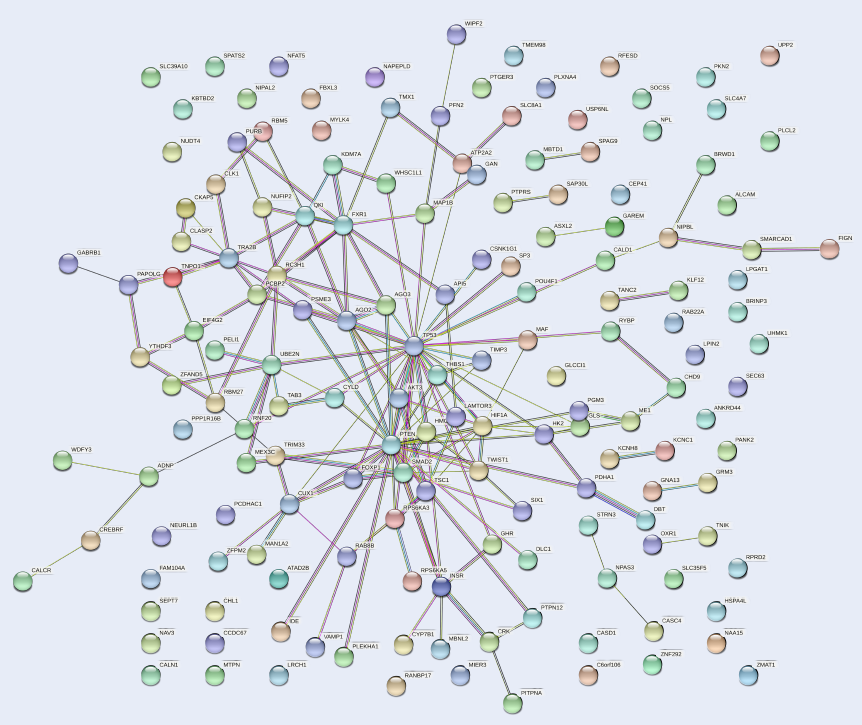
The PPI network of the 159 target genes of hsa-mir-151a-3p revealed various clusters of target genes (Figure 4). One prominent cluster was found around p53, which interacted with AKT3, PTEN, HIF1A, FOXP1, SMAD2, MAF, AGO2, AGO3, and other gene products. Therefore, it could be presumed that p53 is involved in the process of pathogenesis in MM.
Identification of circRNAs interacting with hsa-mir-151a-3p
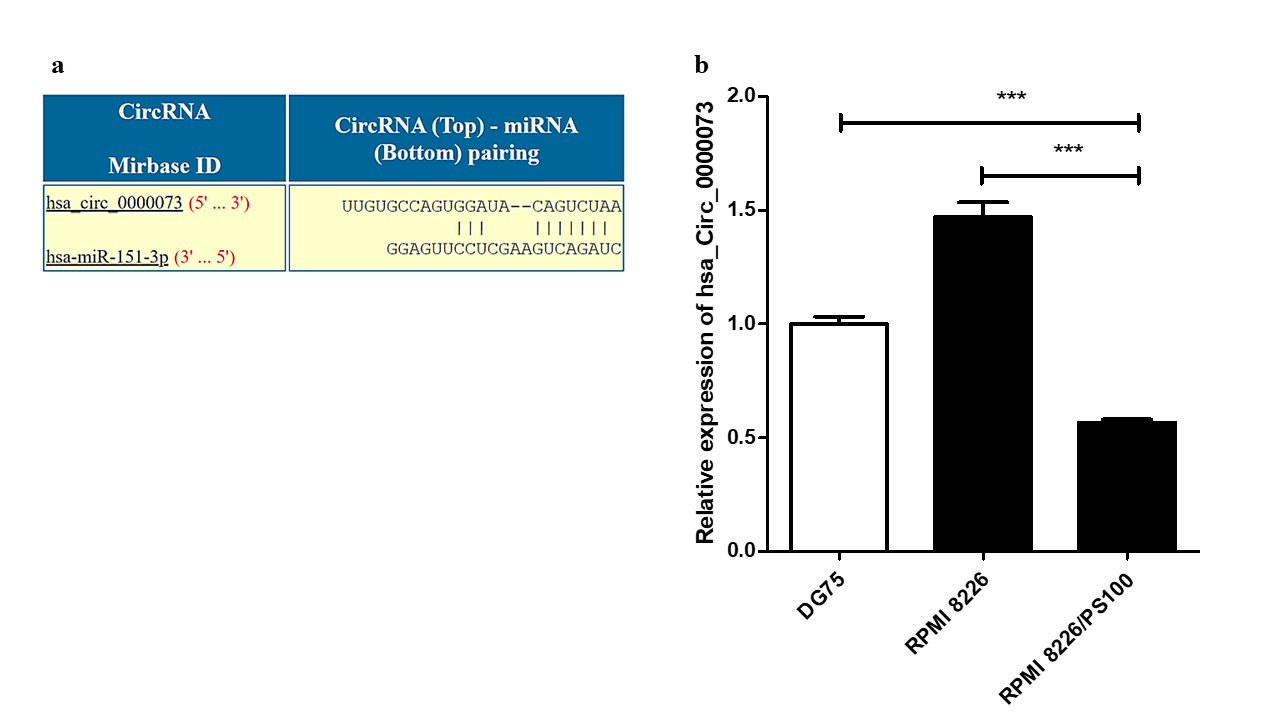
Analysis using the CircInteractome database identified several circRNAs that could potentially interact with hsa-mir-151a-3p. One such circRNA was hsa_circ_0000073, which could interact with hsa-mir-151a-3p (Figure 5 a). The expression of this circRNA was assessed in RPMI 8226 MM cells and BTZ-resistant RPMI 8226/PS100 MM cells. hsa_circ_0000073 was found to be significantly downregulated in BTZ-resistant MM cells (Figure 5 b). Thus, it could be speculated that the downregulation of this circRNA may be one of the causes of the upregulation of the miRNA hsa-mir-151a-3p in BTZ-resistant MM and may contribute to drug resistance in MM.
Expression of p53 in MM and BTZ-resistant MM cell lines
As p53 was found to be targeted by the miRNA hsa-mir-151a-3p by mirDIP software and forms a prominent cluster in the PPI network of target genes of hsa-mir-151a-3p, the expression of p53 was further examined in RPMI 8226 MM cells as well as BTZ-resistant MM cells at both the transcript and protein levels. p53 was found to be significantly downregulated in both MM cells and BTZ-resistant MM cells at both the mRNA and protein levels (Figure 6 b,c,d). Thus, it could be assumed that downregulation of p53 might impart drug resistance in MM.
Discussion
BTZ is used extensively as first-line therapy for many patients with MM throughout the world. However, resistance to BTZ therapy is a serious concern and a huge obstacle in the treatment of MM. Although several studies have aimed to understand the drug resistance mechanism in MM in the past few years, the area still requires active investigation and new therapeutic interventions. Recently, integrated in silico bioinformatics analysis has emerged as a crucial method to examine prognostic targets in cancer19. Microarray-based gene expression profiles have become an important tool to elucidate the mechanisms of cancer progression as well as drug resistance, thus providing essential information for clinical intervention20. Several studies in recent years have shown the importance of miRNAs in the pathogenesis of, drug resistance in, and therapeutic applications in MM21. Therefore, in this study, we used a comprehensive bioinformatics approach to examine two microarray datasets, GSE37053 and GSE24371, and identify some key DEmiRs that might be crucial in the progression of MM and drug resistance. From these two datasets, we have detected 16 common DEmiRs, of which 9 miRNAs were upregulated and 7 miRNAs were downregulated. Of these DEmiRs, mir-221 and mir-222 were among the miRNAs found to be upregulated in our analysis. Earlier studies have shown their oncogenic role in MM, and inhibitors of these miRNAs can attenuate the pathogenesis of MM22. These miRNAs were also implicated in resistance to drugs such as dexamethasone and melphalan in MM23, 24. Another miRNA, mir-148a, was found to be upregulated in our analysis, and has previously been shown to play a role in the proliferation of MM cells by regulating CDKN1B25. Of the downregulated miRNAs detected in our study, mir-26b has been shown to suppress cellular growth and promote apoptosis by targeting JAG1 in MM26.
To our knowledge, the role of hsa-mir-151a-3p, one of the DEmiRs identified in our study, in hematological malignancy has not yet been investigated. It has been shown to have both oncogenic and tumor suppressive roles in different solid cancers. In breast cancer, mir-151-3p exhibits its tumor suppressor role by repressing invasion and migration of cancer cells by regulating the expression of TWIST127. On the other hand, in non-small cell lung cancer (NSCLC), it acts as an oncomiR by enhancing proliferation, migration, and partial epithelial-to-mesenchymal transition of NSCLC cells by targeting E-cadherin28. Extracellular vesicles containing mir-151a-3p facilitate liver metastasis and could be a promising biomarker for diagnosis in gastric cancer29. In our study, we detected the upregulation of mir-151a-3p in MM patient samples by bioinformatics analysis. We also observed its overexpression in BTZ-resistant MM cells. Thus, mir-151a-3p could be considered a potential therapeutic target to overcome BTZ resistance in MM. Further clinical investigations are required to delineate its role in drug resistance in MM.
CircRNA has recently been implicated in several types of cancer, including MM. hsa_circ_0007841 has been shown to confer resistance to BTZ as well as doxorubicin and might be considered as a novel potential biomarker in MM30, 31. CircRERE (has_circ_0009581) has been observed to confer resistance to BTZ by regulating CD47 through targeting miR-152-3p in MM32. In our analysis using the CircInteractome database, hsa_circ_0000073 was found to interact with mir-151a-3p. Earlier studies have shown the oncogenic role of hsa_circ_0000073 in osteosarcoma; moreover, it imparts methotrexate resistance by targeting mir-151-3p and mir-145-5p and upregulating NRAS33, 34. However, to our knowledge, its role in hematological malignancies, including MM, has not yet been studied. We have found that this circRNA is downregulated in BTZ-resistant MM cells; thus, it could be a potential therapeutic agent in drug-resistant MM. It would be of great interest to determine the role of these molecules (hsa-mir-151a-3p and hsa_circ_0007841 and p53) in BTZ-resistant patient samples.
In our study, analysis using the mirDIP database revealed several potential target genes of hsa-mir-151a-3p. Among these target genes, p53 was observed to form several clusters in the PPI network of those target genes. This very crucial tumor suppressor gene has been found to be mutated in most cancers. In MM, several p53 alterations, such as deletion, mutation, epigenetic regulation, regulation by miRNAs, and post-translational regulation, have been detected35. However, its potential role in drug-resistant MM remains to be investigated extensively. We have observed significant downregulation of p53 at both the transcript and protein levels in BTZ-resistant MM cells, which suggests that it could be a potential therapeutic target in drug-resistant MM.
Conclusions
In the current study, we used an in silico bioinformatics approach to detect several DEmiRs in MM. Of them, hsa-mir-151a-3p was detected to be overexpressed in BTZ-resistant MM cells and could thus be a potential therapeutic target in drug-resistant MM. hsa_circ_0000073 and p53 were observed to be downregulated in BTZ-resistant MM, and restoring their expression could serve as a therapeutic strategy in MM. Our observations may improve our understanding of the diagnosis and treatment of BTZ-resistant MM.
Abbreviations
BTZ: Bortezomib, circRNA: Circular RNA, DAVID: Database for Annotation Visualization and Integrated Discovery, DEmiRs: Differentially expressed miRNAs, GEO: Gene Expression Omnibus, GO: Gene ontology, KEGG: Kyoto Encyclopedia of Genes and Genomes, miRNA: Micro RNA, MM: Multiple myeloma, PPI: Protein–protein interaction
Acknowledgments
All authors acknowledge Swami Atmapriyananda, Pro-Chancellor, RKMVERI, for providing infrastructural support.
Author’s contributions
SG conceptualized the study, performed the experiments and analysis, and wrote the manuscript. SC performed experiments. SB supervised the study. All authors read and approved the final version of the manuscript.
Funding
None.
Availability of data and materials
The datasets analyzed in this current study are available in the Gene Expression Omnibus database (https ://www.ncbi.nlm.nih.gov/geo/).
Ethics approval and consent to participate
Not applicable.
Consent for publication
Not applicable.
Competing interests
The authors declare that they have no competing interests.
References
-
van de Donk
N.W.,
Pawlyn
C.,
Yong
K.L.,
Multiple myeloma. Lancet.
2021;
397
(10272)
:
410-27
.
View Article PubMed Google Scholar -
Rajkumar
S.V.,
Dimopoulos
M.A.,
Palumbo
A.,
Blade
J.,
Merlini
G.,
Mateos
M.V.,
International Myeloma Working Group updated criteria for the diagnosis of multiple myeloma. The Lancet. Oncology.
2014;
15
(12)
:
e538-48
.
View Article PubMed Google Scholar -
Rajkumar
S.V.,
Multiple myeloma: 2016 update on diagnosis, risk-stratification, and management. American Journal of Hematology.
2016;
91
(7)
:
719-34
.
View Article PubMed Google Scholar -
Kyle
R.A.,
Therneau
T.M.,
Rajkumar
S.V.,
Larson
D.R.,
Plevak
M.F.,
Offord
J.R.,
Prevalence of monoclonal gammopathy of undetermined significance. The New England Journal of Medicine.
2006;
354
(13)
:
1362-9
.
View Article PubMed Google Scholar -
Landgren
O.,
Kyle
R.A.,
Pfeiffer
R.M.,
Katzmann
J.A.,
Caporaso
N.E.,
Hayes
R.B.,
Monoclonal gammopathy of undetermined significance (MGUS) consistently precedes multiple myeloma: a prospective study. Blood.
2009;
113
(22)
:
5412-7
.
View Article PubMed Google Scholar -
Iida
S.,
Mechanisms of action and resistance for multiple myeloma novel drug treatments. International Journal of Hematology.
2016;
104
(3)
:
271-2
.
View Article PubMed Google Scholar -
Moreau
P.,
Richardson
P.G.,
Cavo
M.,
Orlowski
R.Z.,
San Miguel
J.F.,
Palumbo
A.,
Proteasome inhibitors in multiple myeloma: 10 years later. Blood.
2012;
120
(5)
:
947-59
.
View Article PubMed Google Scholar -
Yuan
X.,
Ma
R.,
Yang
S.,
Jiang
L.,
Wang
Z.,
Zhu
Z.,
miR-520g and miR-520h overcome bortezomib resistance in multiple myeloma via suppressing APE1. Cell Cycle (Georgetown, Tex.).
2019;
18
(14)
:
1660-9
.
View Article PubMed Google Scholar -
Edgar
R.,
Domrachev
M.,
Lash
A.E.,
Gene Expression Omnibus: NCBI gene expression and hybridization array data repository. Nucleic Acids Research.
2002;
30
(1)
:
207-10
.
View Article PubMed Google Scholar -
Lionetti
M.,
Musto
P.,
Di Martino
M.T.,
Fabris
S.,
Agnelli
L.,
Todoerti
K.,
Biological and clinical relevance of miRNA expression signatures in primary plasma cell leukemia. Clinical Cancer Research.
2013;
19
(12)
:
3130-42
.
View Article PubMed Google Scholar -
Chi
J.,
Ballabio
E.,
Chen
X.H.,
MicroRNA expression in multiple myeloma is associated with genetic subtype, isotype and survival. Biol Direct.
2011;
6
:
23
.
View Article Google Scholar -
Ritchie
M.E.,
Phipson
B.,
Wu
D.,
Hu
Y.,
Law
C.W.,
Shi
W.,
limma powers differential expression analyses for RNA-sequencing and microarray studies. Nucleic Acids Research.
2015;
43
(7)
:
e47
.
View Article PubMed Google Scholar -
Tokar
T.,
Pastrello
C.,
Rossos
A.E.,
Abovsky
M.,
Hauschild
A.C.,
Tsay
M.,
mirDIP 4.1-integrative database of human microRNA target predictions. Nucleic Acids Research.
2018;
46
:
360-70
.
View Article PubMed Google Scholar -
Huang
W.,
Sherman
B.T.,
Lempicki
R.A.,
Systematic and integrative analysis of large gene lists using DAVID bioinformatics resources. Nature Protocols.
2009;
4
(1)
:
44-57
.
View Article PubMed Google Scholar -
Szklarczyk
D.,
Gable
A.L.,
Lyon
D.,
Junge
A.,
Wyder
S.,
Huerta-Cepas
J.,
STRING v11: protein-protein association networks with increased coverage, supporting functional discovery in genome-wide experimental datasets. Nucleic Acids Research.
2019;
47
:
607-13
.
View Article PubMed Google Scholar -
Almeida
D.,
Azevedo
V.,
Silva
A.,
Baumbach
J.,
PetriScape - A plugin for discrete Petri net simulations in Cytoscape. Journal of Integrative Bioinformatics.
2016;
13
(1)
:
284
.
View Article PubMed Google Scholar -
Dudekula
D.B.,
Panda
A.C.,
Grammatikakis
I.,
De
S.,
Abdelmohsen
K.,
Gorospe
M.,
CircInteractome: A web tool for exploring circular RNAs and their interacting proteins and microRNAs. RNA Biology.
2016;
13
(1)
:
34-42
.
View Article PubMed Google Scholar -
Franke
N.E.,
Niewerth
D.,
Assaraf
Y.G.,
van Meerloo
J.,
Vojtekova
K.,
van Zantwijk
C.H.,
Impaired bortezomib binding to mutant β5 subunit of the proteasome is the underlying basis for bortezomib resistance in leukemia cells. Leukemia.
2012;
26
(4)
:
757-68
.
View Article PubMed Google Scholar -
Wang
X.,
Liotta
L.,
Clinical bioinformatics: a new emerging science. J Clin Bioinforma.
2011;
1
(1)
:
1
.
View Article Google Scholar -
Russo
G.,
Zegar
C.,
Giordano
A.,
Advantages and limitations of microarray technology in human cancer. Oncogene.
2003;
22
(42)
:
6497-507
.
View Article PubMed Google Scholar -
Allegra
A.,
Ettari
R.,
Innao
V.,
Bitto
A.,
Potential Role of microRNAs in inducing Drug Resistance in Patients with Multiple Myeloma. Cells.
2021;
10
(2)
:
448
.
View Article Google Scholar -
Di Martino
M.T.,
Gullà
A.,
Cantafio
M.E.,
Lionetti
M.,
Leone
E.,
Amodio
N.,
In vitro and in vivo anti-tumor activity of miR-221/222 inhibitors in multiple myeloma. Oncotarget.
2013;
4
(2)
:
242-55
.
View Article PubMed Google Scholar -
Xu
J.,
Su
Y.,
Xu
A.,
Fan
F.,
Mu
S.,
Chen
L.,
miR-221/222-Mediated Inhibition of Autophagy Promotes Dexamethasone Resistance in Multiple Myeloma. Molecular Therapy.
2019;
27
(3)
:
559-70
.
View Article PubMed Google Scholar -
Gullà
A.,
Di Martino
M.T.,
Gallo Cantafio
M.E.,
Morelli
E.,
Amodio
N.,
Botta
C.,
A 13 mer LNA-i-miR-221 Inhibitor Restores Drug Sensitivity in Melphalan-Refractory Multiple Myeloma Cells. Clinical Cancer Research.
2016;
22
(5)
:
1222-33
.
View Article PubMed Google Scholar -
Lang
T.,
Nie
Y.,
MiR-148a participates in the growth of RPMI8226 multiple myeloma cells by regulating CDKN1B. Biomedicine and Pharmacotherapy.
2016;
84
:
1967-71
.
View Article PubMed Google Scholar -
Jia
C.M.,
Tian
Y.Y.,
Quan
L.N.,
Jiang
L.,
Liu
A.C.,
miR-26b-5p suppresses proliferation and promotes apoptosis in multiple myeloma cells by targeting JAG1. Pathology, Research and Practice.
2018;
214
(9)
:
1388-94
.
View Article PubMed Google Scholar -
Yeh
T.C.,
Huang
T.T.,
Yeh
T.S.,
miR-151-3p Targets TWIST1 to Repress Migration of Human Breast Cancer Cells. PLoS One.
2016;
11
(12)
:
e0168171
.
View Article Google Scholar -
Daugaard
I.,
Sanders
K.J.,
Idica
A.,
miR-151a induces partial EMT by regulating E-cadherin in NSCLC cells. Oncogenesis.
2017;
6
(7)
:
e366
.
View Article Google Scholar -
Li
B.,
Xia
Y.,
Lv
J.,
Wang
W.,
Xuan
Z.,
Chen
C.,
miR-151a-3p-rich small extracellular vesicles derived from gastric cancer accelerate liver metastasis via initiating a hepatic stemness-enhancing niche. Oncogene.
2021;
40
(43)
:
6180-94
.
View Article PubMed Google Scholar -
Gao
M.,
Li
C.,
Xiao
H.,
hsa_circ_0007841: A Novel Potential Biomarker and Drug Resistance for Multiple Myeloma. Front Oncol.
2019;
9
:
1261
.
View Article Google Scholar -
Song
Y.,
Hu
N.,
Song
X.,
Yang
J.,
Hsa_Circ_0007841 Enhances Multiple Myeloma Chemotherapy Resistance Through Upregulating ABCG2. Technology in Cancer Research & Treatment.
2020;
19
:
1533033820928371
.
View Article PubMed Google Scholar -
Fang
W.,
Mu
J.,
Yang
Y.,
Liu
L.,
CircRERE confers the resistance of multiple myeloma to bortezomib depending on the regulation of CD47 by exerting the sponge effect on miR-152-3p. J Bone Oncol.
2021;
30
(30)
:
100381
.
View Article Google Scholar -
Li
X.,
Liu
Y.,
Zhang
X.,
Shen
J.,
Xu
R.,
Liu
Y.,
Circular RNA hsa_circ_0000073 contributes to osteosarcoma cell proliferation, migration, invasion and methotrexate resistance by sponging miR-145-5p and miR-151-3p and upregulating NRAS. Aging (Albany NY).
2020;
12
(14)
:
14157-73
.
View Article PubMed Google Scholar -
Ren
Z.,
Yang
Q.,
Guo
J.,
Circular RNA hsa_circ_0000073 Enhances Osteosarcoma Cells Malignant Behavior by Sponging miR-1252-5p and Modulating CCNE2 and MDM2. Front Cell Dev Biol.
2021;
9
:
714601
.
View Article Google Scholar -
Jovanović
K.K.,
Escure
G.,
Demonchy
J.,
Deregulation and Targeting of TP53 Pathway in Multiple Myeloma. Front Oncol.
2019;
8
:
665
.
View Article Google Scholar
Comments
Article Details
Volume & Issue : Vol 9 No 7 (2022)
Page No.: 5179-5190
Published on: 2022-07-31
Citations
Copyrights & License
This work is licensed under a Creative Commons Attribution 4.0 International License.
Search Panel
Pubmed
Google Scholar
Pubmed
Google Scholar
Pubmed
Search for this article in:
Google Scholar
Researchgate
- HTML viewed - 2529 times
- PDF downloaded - 582 times
- XML downloaded - 0 times
