

Relation of osteoprotegerin level and numerous of circulating progenitor mononuclears in patients with metabolic syndrome
Copyrights: Alexander E. Berezin, Alexander A Kremzer, Tatyana A Berezina, Yulia V Martovitskaya, Elena A Gromenko, 2016. License: This work is licensed under a Creative Commons Attribution 4.0 International License.
Abstract
The aim of the study: to investigate whether an elevated level of osteoprotegerin (OPG) predicts imbalance between different phenotypes of circulating endothelial (EPCs) and mononuclear (MPCs) progenitor cells in patients with MetS.
Methods: Forty seven patients with MetS and 35 healthy volunteers were prospectively evolved in the study 47 between February 2013 and November 2013. We enrolled MetS subjects without known CV disease including angina pectoris, asymptomatic atherosclerosis (negative contrast-enhanced multispiral tomography angiography). MetS was diagnosed based on the National Cholesterol Education Program Adult Treatment Panel III criteria. All patients have given their informed written consent for participation in the study.
Results: The mean serum level of OPG was significantly higher among entire MetS patients’ cohort compared to the healthy volunteers (1142 ± 186 pg/mL in MetS group vs. 245 ± 75 pg/mL in control group; p < 0.001). Patients with MetS were divided in to two subgroups depended on serum level of OPG using mean value as cutoff point. Subjects with OPG level < 1142 pg/mL and ≥ 1142 pg/mL were included in cohorts with lower (n=18) and higher (n=29) OPG level, respectively.Multivariate regression analysis adjusted age, sex and BMI has shown that OPD related negatively with numbers of CD14+/CD309+ cells (r = -0.505, P = 0.001), CD14/CD309/Tie2+ (= -0.510, P = 0.001), CD45-/CD34+ cells (r = -0.298, P = 0.001), triglycerides (r = -0.22, P = 0.001), hs-CRP (r = -0.24, P = 0.001), dyslipidemia (r = -0.301, P = 0.001), LDL cholesterol (r = -0.288, P = 0.002), soluble receptor activator of nuclear factor kappa-B ligand (r = -0.303, P = 0.001), serum uric acid (r = -0.218, P < 0.001), and positively related with galectin-3 (r =0.41, P = 0.001), HOMA-IR (r = 0.306, P = 0.001), The MetS Z score at +1.0 SD (r =0.262, P = 0.001), Framingham risk score (r = 0.254, P = 0.001). In multivariate logistic regression analysis we found that OPG, dyslipidemia, galectin-3, and HOMA-IR were independent predictors for depletion in numerous of circulating EPCs and MPCs alone, as well as combined variable: EPCs and MPCs. The comparison of predictive models based on several biomarkers including dyslipidemia, galectin-3, and HOMA-IR has shown a lack of advantages of these models versus predictive model constructed on OPG alone.
Conclusion: We found the elevated OPG level in MetS patients without known CV disease predicted declined numerous of both EPCs and MPCs beyond traditional CV risk factors.
Introduction
Metabolic syndrome (MetS) is defined as cluster of multiple metabolic and cardiovascular (CV) abnormalities included abdominal obesity, high-normal blood pressure, dyslipidaemia, and impaired fasting glucose tolerance Grundy et al., 2005Grundy et al., 2004, that exhibits has a growing prevalence worldwide Scholze et al.,2010Tocci et al., 2015. Recent clinical and observational studies have revealed that MetS closely associates with progression to type 2 diabetes mellitus (T2DM) in non-diabetics, asymptomatic atherosclerosis, vascular calcification, increased stiffness of peripheral and central arteries, low-grade inflammation, and prothrombotic state Cicero et al., 2007Lee et al., 2015Rhee et al., 2014Rhee et al., 2013. Moreover, MetS was found as predictor of CV disease development, CV mortality, and sudden cardiac death Baumgartner et al., 2012Kurl et al., 2016.
In the general clinical practice CV risk assessment is mostly based on risk charts, such as Framingham risk score and Systemic Coronary Risk Estimation Volpe et al., 2012. These models are able to estimate the impact of CV and metabolic risk factors, but could not exactly assess individual CV risk profile in MetS individuals. In this context, novel biomarkers reflected several faces of pathogenesis of MetS might improve the discriminative value of contemporary charts Sattar et al., 2003. The clinical advantages regarding adding the evaluation of simple organ damage markers to risk charts in CV risk prediction might be in deep documented. Indeed, patients with MetS presented impaired endothelial function already at early stage of the disease Walczak et al., 2015, and biomarker of endothelial dysfunction and vascular remodeling could improve discriminative value of traditional model.
Osteoprotegerin (OPG) is a secreted multi functional glycoprotein belonging to the tumor necrosis factor (TNF) receptor super family and secreted by activated mononuclear cells Vitovski et al., 2007. OPG acts as a decoy receptor for receptor activator of nuclear factor kappa-B ligand (RANKL) and TNF-related apoptosisinducing ligand, which plays an important regulatory role in the CV system Jono et al., 2002. It has been in progress documented that OPG might link low-grade inflammation, endothelial dysfunction, atherosclerosis and vascular calcification Van Campenhout and Golledge, 2009. Elevated level of OPG was recently found in patients with MetS and T2DM Pérez de Ciriza et al., 2015. There is a large body of evidence regarding predictive role of OPG in asymptomatic atherosclerosis, CV disease and events, and CV mortality Morisawa et al., 2015Niu et al., 2015Venuraju et al., 2010. However, the exact molecular mechanisms mediated OPG / RANK / RANKL axis and vascular complications in MetS have not yet elucidated.
It has suggested that OPG might act via suppression of endogenous repair system activity, in particularly, included both endothelial and mononuclear progenitor cells with angiopoetic capacities Berezin, 2014Tousoulis et al., 2013. Indeed, in MetS patients activated T cells and mononuclears are undergo various metabolic changes affected their growth, differentiation, and proliferation Palmer et al., 2015. In fact, several intracellular signaling systems, i.e. PI3K/Akt, mTOR, HIF1α, p70S6K and Bcl-6, interplaying in inflammation and in the regulation of glucose metabolism, could mediate a development of angiopoetic progenitor cells’ dysfunction in several dysmetabolic states including MetS Berezin AE, 2015a, bKim et al., 2013. Therefore, circulating endothelial progenitor cells (EPCs) were surrogate marker of subclinical atherosclerosis in general population, while mononuclear progenitor cells (MPCs) were found a predictor of coronary artery disease in dysmetabolic patients Hofbauer and Schoppet,2004Kim et al., 2013. All these findings are kept an assumption that worsening ability of EPCs and MPCs to restore tissue injury might clue to link OPG and target organ damage in MetS and diabetes.
The aim of the study: to investigate whether an elevated level of OPG might predict imbalance between different phenotypes of circulating endothelial and mononuclear progenitor cells in MetS patients.
Methods
The study evolved 47 patients with MetS and 35 healthy volunteers who were examined in three our centers between February 2013 and November 2013. We enrolled dysmetabolic disorder subjects without known CV disease including angina pectoris, asymptomatic atherosclerosis (negative contrast-enhanced multispiral tomography angiography), as well as known type 2 diabetes mellitus (T2DM). All patients have given their informed written consent for participation in the study.
MetS was diagnosed based on the National Cholesterol Education Program Adult Treatment Panel III criteria (Health, 2001). Patients were enrolled in the MetS cohort when at least three of the following components were defined: waist circumference ≥90 cm or ≥80 cm in men and women respectively; high density lipoprotein (HDL) cholesterol <1.03 mmol/L or <1.3 mmol/L in men and women respectively; triglycerides ≥1.7 mmol/L; blood pressure ≥130/85 mmHg or current exposure of antihypertensive drugs; fasting plasma glucose ≥5.6 mmol/L.
When T2DM was diagnosed with revised criteria (glycated hemoglobin [HbA1c] ≥6.5%; fasting plasma glucose ≥7 mmol/L; 2-h plasma glucose ≥11.1 mmol/L during an oral glucose tolerance test; a random plasma glucose ≥11.1 mmol/L; exposure of insulin or oral antidiabetic drugs; a previous diagnosis of T2DM) provided by American Diabetes Association, subjects were not considered a candidate for this study.
Current smoking was defined as consumption of one cigarette daily for three months. Anthropometric measurements (body mass, waist circumference, weight, and waist-to-hip ratio) were made using standard procedures.
Methods for visualization of coronary arteries
Contrast-enhanced multispiral computed tomography angiography was performed for all the patients with dysmetabolic disorder prior to their inclusion in the study on Optima СТ660 scanner (GE Healthcare, USA) using non-ionic contrast “Omnipaque” (Amersham Health, Ireland) Bluemke et al., 2008. Asymptomatic atherosclerosis was defined as stenosis of plaque at least in one coronary artery > 50%, aortic root calcification, and / or coronary calcification quantified using Agatston scoring Schuhbaeck et al., 2015.
Echocardiography and Doppler imaging
Transthoracic B-mode echocardiography and Tissue Doppler Imaging were performed according to a conventional procedure on ACUSON scanner (SIEMENS, Germany) using phased probe with modulated frequency of 2.5-5 МHz. Left ventricular end-diastolic and end-systolic volumes, and LVEF were measured by modified Simpson’s method Rodgers et al., 2000.
LV mass was estimated using formula recommended American Society of Echocardiography’s Guidelines and Standards Committee and the Chamber Quantification Writing Group Lang et al., 2005. LV hypertrophy (LVH) was defined as a LV mass / body surface area (BSA) ≥ 96 g/m2, for women, and ≥ 116 g/m2, for men Mancia et al., 2013.
Cardiovascular Risk Calculation
A 10-year cardiovascular risk for study patients was calculated using the Framingham General Cardiovascular Risk Score (2008) Preiss and Kristensen, 2015 by on-line calculator.
MetS Z-score Calculation
The MetS Z score was calculated using the online calculator (http://mets.health-outcomespolicy.ufl.edu/calculator/). The scores are standardized to reflect Z-scores, with a mean set to 0 and a range from negative infinity to positive infinity based on the number of standard deviations from the mean, and can easily be translated to percentiles that allow for a representation of one’s MetS severity relative to the population taking into consideration that MetS was identified accordingly NHANES criteria DeBoer et al., 2015. These score represents a means of estimating MetS severity in a way that corresponds to longterm disease risk.
Calculation of glomerular filtration rate
Glomerular filtration rate (GFR) was calculated with CKD-EPI formula Levey et al.,2009.
Measurement of circulating biomarkers
To determine circulating biomarkers, blood samples were collected at baseline in the morning (at 7-8 a.m.) into cooled silicone test tubes wherein 2 mL of 5% Trilon B solution were added. Then they were centrifuged upon permanent cooling at 6,000 rpm for 3 minutes. Plasma was collected and refrigerated immediately to be stored at a temperature -70оС. Serum osteoprotegerin (OPG), Receptor activator of nuclear factor kappa-B ligand (RANKL), and adiponectin were measured by high-sensitive enzyme-linked immunosorbent assays using commercial kits (R&D Systems GmbH, Wiesbaden-Nordenstadt, Germany) according to the manufacturer’s recommendations. The inter-assay coefficients of variation were as follows: OPG: 8.2%, Receptor activator of nuclear factor kappa- B ligand: 7.0%; adiponectin: 5%.
High-sensitive C-reactive protein (hs-CRP) was measured by commercially available standard kit (R&D Systems GmbH, Wiesbaden-Nordenstadt, Germany). The intra-assay and inter-assay coefficients of variation were <5%.
Fasting insulin level was measured by a doubleantibody sandwich immunoassay (Elecsys 1010 analyzer, F. Hoffmann-La Roche Diagnostics, Mannheim, Germany). The intra-assay and inter-assay coefficients of variation were <5%. The lower detection limit of insulin level was 1.39 pmol/L.
Insulin resistance was assessed by the homeostasis model assessment for insulin resistance (HOMAIR) Matthews et al., 1985 using the following formula:
HOMA-IR (mmol/L × μU/mL) = fasting glucose (mmol/L) × fasting insulin (μU/mL) / 22.5
IR was arbitrarily defined as a homeostasis model assessment-IR index (HOMA-IR) value above the 75th percentile of normal glucose tolerance equal 2.45 mmol/L × μU/mL.
Hemoglobin A1c (HbA1c) were determined by highpressure liquid chromatography method. Concentrations of total cholesterol (TC), cholesterol of highdensity lipoproteins (HDL-C), triglycerides (TG), and low-density lipoproteins (LDL-C) were measured by direct enzymatic method (Roche P800 analyzer, Basel, Switzerland).
Blood sampling for measurement of circulating endothelial progenitor cells and mononuclear progenitor cells
Blood samples were received from peripheral vein in blood collection tubes. Each sample contains 75 μL into 1mL PBS containing 5 μM EDTA (10 μL of 0.5 M stock). To prevent clotting samples were mixed immediately. Peripheral blood mononuclear cells were removed using density gradient centrifugation with Ficoll-Paque (Miltenyi Biotec Inc., Germany). After layer 35 mL of diluted cell suspension over 15 mL of Ficoll-Paque in a 50 mL conical tube all blood samples with anticoagulants (EDTA) have centrifuged at 400×g for 30–40 minutes at 20°C in a swinging-bucket rotor without brake. The upper layer leaving the mononuclear cell layer was aspirated to prevent a contamination of samples before measurement of real EPCs.
RBCs from samples were removed from the samples using the classic LYSE-WASH protocol. Cells were washed 2-3x with FACS buffer (PBS supplemented with either 1% BSA or 5% FBS and containing 0.05% NaNO3). Fifty μL FACS buffer per each analysis on a single sample was suspended the pellet from the final wash. Then 50 μL of cell suspension to 10 μL of antibody solution were added and immediately mixed.
After incubation for 30 minutes on ice cells 2-3x with FACS buffer was washed and suspended in 200-300 μL FACS buffer for analysis. The samples were centrifuged at 200× g for 15 min; then they were washed twice with PBS and fixed immediately.
Determination of circulating EPCs
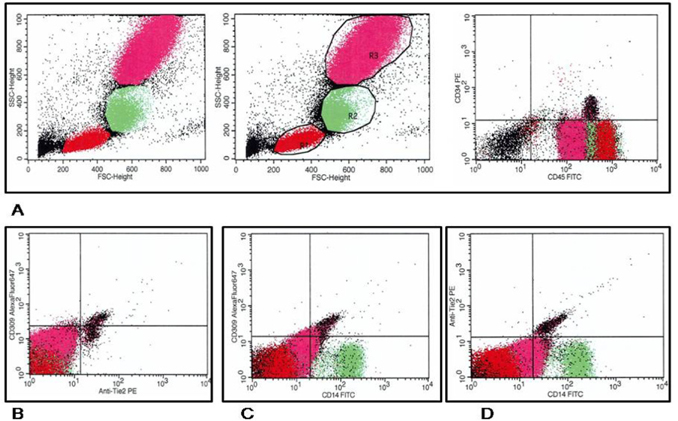
For further analysis, endothelial derived and mononuclear progenitor cells were re-suspended in 100 μl of a fluorescence-activated cell-sorting buffer containing phosphate-buffered saline, 0.1 percent bovinealbumin, and aprotinin (20 μL /mL). The flow cytometric technique (FCT) was used for predictably distinguishing circulating cell subsets, which depend on expression of CD45, CD34, CD14, Tie-2, and VEGFR2, using High-Definition Fluorescence Activated Cell Sorter (HD-FACS) methodology Tung et al., 2004.
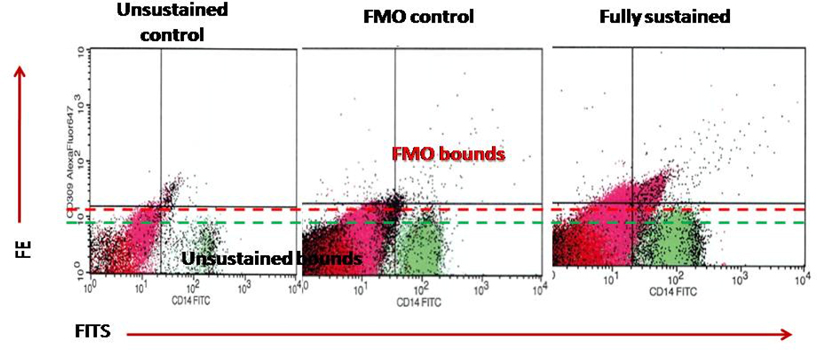
Accordingly, the cells were labeled on the basis of their forward scatter characteristic (FSC) and side scatter characteristic (SSC) profiles. The cells were directly stained and analyzed for phenotypic expression of surface proteins using anti-human monoclonal antibodies, including anti-CD45 FITS (BD Biosciences, San Jose, CA, USA), anti-CD34 FITS (BD Biosciences), anti- VEGFR-2 known as anti-CD309 (BD Biosciences), anti- Tie2 (BD Biosciences) and anti-CD14 (BD Biosciences). The fluorescence minus one technique was used to provide negative controls and establish positive stain boundaries. Double- or triple-positive events were determined using Boolean principles (“and”, “not”, “or”, etc.). IgG2a–FITC–PE antibody (Becton Dickinson) served as a negative control.
Circulating EPCs were defined as CD34/CD309 positive cells with lack of CD45 expression. CD14 is common antigen for mononuclears and endothelial cells, while CD309 antigen is represented in endothelial cells. For mononuclear progenitor CD14+ cells’ populations, co-expression with Tie-2− and/or VEGFR-2− was determined using quadrant analysis. Cell fluorescence was measured immediately after staining, and data were analyzed with the use of Cell Quest software (FACS Calibur, Becton Dickinson). Units of all measured components are absolute cell counts obtained after the measurement of 500,000 events. The Fluorescence Minus One Control (FMO control) was used to properly interpret flow cytometry data. Figure 1 represents a sample of FACS results for CD45- /CD34+, СD309+/antiTie2-, CD14+/СD309+, СD14+/antiTie2- EPCs. FMO controls for CD14+/СD309+ is reported Figure 2 .
Statistical Analysis
Statistical analysis of the results obtained was performed in SPSS system for Windows, Version 22 (SPSS Inc, Chicago, IL, USA). The data were presented as mean (М) and standard deviation (±SD) or 95% confidence interval (CI); as well as median (Ме) and 25%- 75% interquartile range (IQR). To compare the main parameters of patient cohorts, two-tailed Student t-test or Mann–Wilk U-test were used. To compare categorical variables between groups, Chi2 test (χ2) and Fisher F exact test were used. Predictors of EPCs in patients were examined in multivariable regression analysis. C-statistics, integrated discrimination indices (IDI) and net-reclassification improvement (NRI) were utilized for prediction performance analyses. A twotailed probability value of <0.05 was considered as significant.
Results
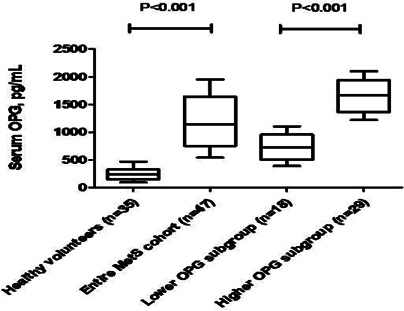
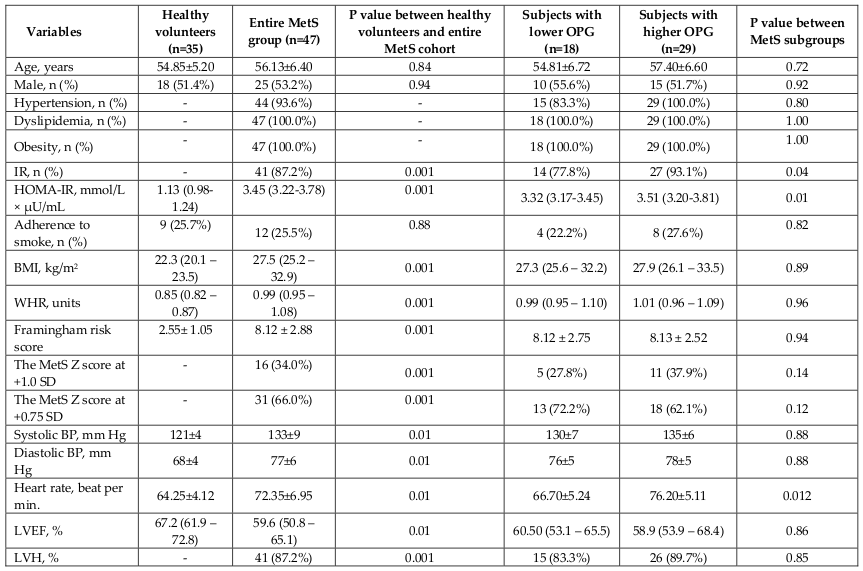
The mean serum level of OPG was significantly higher among entire MetS patients’ cohort compared to the healthy volunteers (1142 ± 186 pg/mL in MetS group vs. 245 ± 75 pg/mL in control group; p < 0.001). Patients with MetS were divided into two subgroups depended on serum level of OPG using mean value as cutoff point ( Figure 3 ). Subjects with OPG level < 1142 pg/mL and ≥ 1142 pg/mL were included in cohorts with lower (n=18) and higher (n=29) OPG level, respectively. There was not a significant difference between healthy volunteers and entire MetS cohort in age, sex, and adherence to smoke. MetS subjects exhibited higher BMI, WHR, Framingham risk score, HOMA-IR, The MetS Z score average, LVH presentation, blood pressure, and heart rate. We did not find sufficient differences between MetS subgroups with lower and higher serum OPG level in demographics, cardiovascular risk factors, and hemodynamic performances, apart from the heart rate that exibited lower value in individuals with circulating OPG < 1142 pg/mL compared with those who had OPG level ≥ 1142 pg/mL. Therefore, insulin resistance (IR) has determined frequently in lower OPG subgroup vs higher OPG subgroup (P=0.04).
As shown in Table 1 , healthy volunteers and MetS individuals from entire cohort had similar level of GFR, hemoglobin, creatinine, uric acid, and NT-pro-BNP. We expectedly found increased level of fasting glucose, HbA1c, total cholesterol, LDL cholesterol, triglycerides, hs-CRP, and galectin-3, sRANKL, adiponectin, as well as lowered concentration of HDL cholesterol in entire MetS cohort compared with healthy volunteers. No difference was seen in GFR, hemoglobin, fasting glucose, HbA1c, creatinine, total cholesterol, NT-pro-BNP, hs-CRP between both MetS subgroups ( Table 2 ). The MetS patients with higher OPG level had higher levels of uric acid, LDL cholesterol, triglycerides, galectin-3, and lower concentrations of HDL cholesterol.
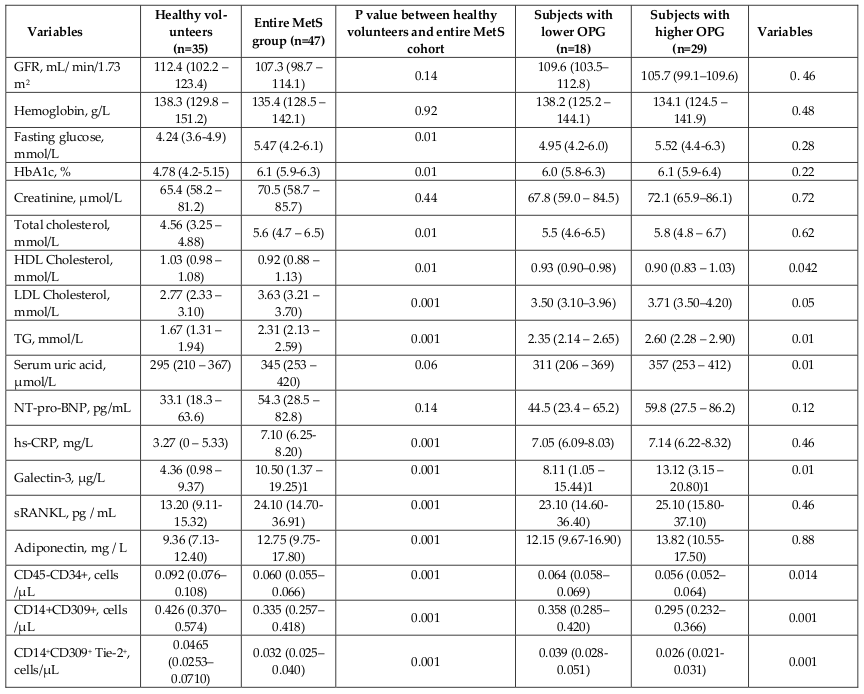
Healthy volunteers had increased level of both EPCs and MPCs in comparison with entire cohort of MetS patients (P=0.001 for all cases). Furthermore, CD45- CD34+, CD14+CD309+, CD14+СD309+ Tie-2+ cells exhibited significantly higher circulating concentrations in MetS patients with lower OPG level compared with individuals with higher OPG level.
The univariate linear regression analysis between OPG and absolute numerous of EPCs and MPCs with immune phenotypes CD45-/CD34+ CD14/CD309+ and CD14/CD309/Tie2+, cardiovascular risk factors, hemodynamic performances, and other biomarkers was performed. Serum OPG level inversely related with absolute numbers of CD14+/CD309+ cells (r = -0.512, P = 0.001), CD14/CD309/Tie2+ (= -0.509, P = 0.001), CD45-/CD34+ cells (r = -0.422, P = 0.001), BMI (r = - 0.34, P = 0.001), male sex (r = -0.31, P = 0.001), triglycerides (r = -0.28, P = 0.001), hs-CRP (r = -0.318, P = 0.001), dyslipidemia (r = -0.313, P = 0.001), LDL cholesterol (r = -0.311, P = 0.002), soluble receptor activator of nuclear factor kappa-B ligand (r = -0.312, P = 0.001), serum uric acid (r = -0.305, P < 0.001), adiponectin (r = - 0.292, P = 0.001), eGFR (r = -0.288, P = 0.001), creatinine (r = -0.287, P = 0.001), age (r = -0.275, P = 0.001), smoking (r = -0.212, P = 0.001), and positively related with galectin-3 (r =0.442, P = 0.001), HOMA-IR (r = 0.315, P = 0.001), The MetS Z score at +1.0 SD (r =0.312, P = 0.001), Framingham risk score (r = 0.304, P = 0.001), LVH (r =0.306, P = 0.001).
Multivariate regression analysis adjusted age, sex and BMI has shown that OPD related negatively with numbers of CD14+/CD309+ cells (r = -0.505, P = 0.001), CD14/CD309/Tie2+ (= -0.510, P = 0.001), CD45-/CD34+ cells (r = -0.298, P = 0.001), triglycerides (r = -0.22, P = 0.001), hs-CRP (r = -0.24, P = 0.001), dyslipidemia (r = - 0.301, P = 0.001), LDL cholesterol (r = -0.288, P = 0.002), soluble receptor activator of nuclear factor kappa-B ligand (r = -0.303, P = 0.001), serum uric acid (r = - 0.218, P < 0.001), and positively related with galectin-3 (r =0.41, P = 0.001), HOMA-IR (r = 0.306, P = 0.001), The MetS Z score at +1.0 SD (r =0.262, P = 0.001), Framingham risk score (r = 0.254, P = 0.001).
When we excluded from this analysis dyslipidemia, no relation of OPG with CD45-/CD34+ cells (r = -0.18, P = 0.36), The MetS Z score at +1.0 SD (r = 0.122, P = 0.22), Framingham risk score (r = 0.14, P = 0.16), serum uric acid (r = -0.15, P = 0.12) was seen, whereas association between OPG and numbers of CD14+/CD309+ cells (r = -0.42, P = 0.001), CD14/CD309/Tie2+ (r = -0.44, P = 0.001), soluble receptor activator of nuclear factor kappa-B ligand (r = -0.24, P = 0.001), and positively related with galectin-3 (r =0.41, P = 0.001), HOMA-IR (r = 0.306, P = 0.001).
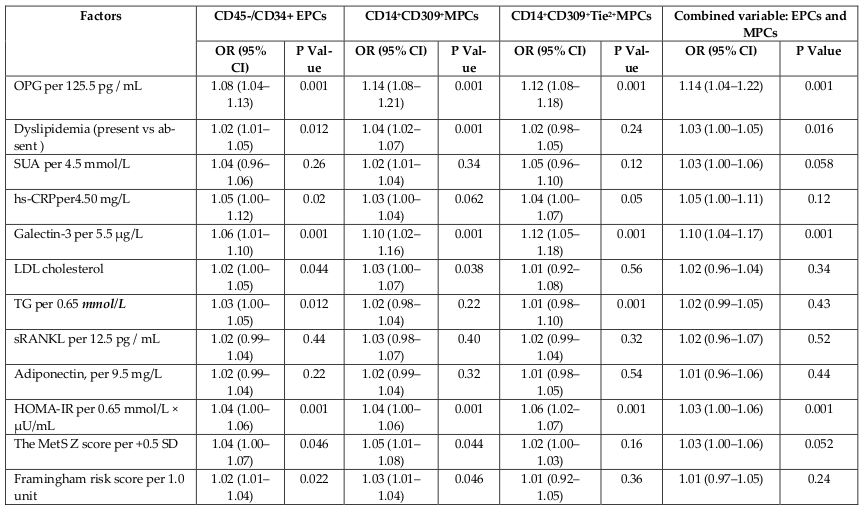
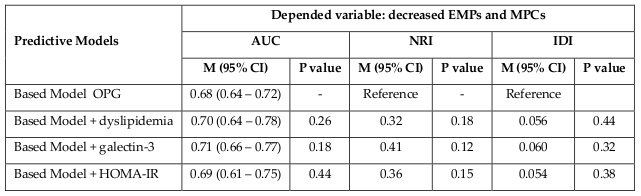
In multivariate logistic regression analysis, we found that OPG, dyslipidemia, galectin-3, and HOMA-IR were independent predictors for depletion in numerous of circulating EPCs and MPCs alone, as well as combined variable: EPCs and MPCs ( Table 3 ). The comparison of predictive models based on several biomarkers including dyslipidemia, galectin-3, and HOMA-IR has shown a lack of advantages of these models versus predictive model constructed on OPG alone ( Table 4 ).
Discussion
The results of our study have shown the higher predictive value of elevated OPG level in depletion of circulating EPCs and MPCs in MetS patients without known T2DM, CV disease and beyond traditional CV risk factors. Recent studies have been elucidated that OPG exhibits strongly association with incident of CV disease and CV mortality in diabetics Gordin et al., 2013Lieb et al., 2010Pérez de Ciriza et al., 2015. Although OPG showed significant higher levels in T2DM patients with MetS than those without MetS Ahmed et al., 2015, OPG might be implicated in the pathogenesis of MetS in individuals without T2DM. Indeed, OPG has been involved in the process that causes vascular stiffness, endothelial dysfunction, and worsening endothelial reparation Morisawa et al., 2015Niu et al., 2015.
In MetS increased visceral adipose tissue (VAT), dyslipidemia and inflammation are considered an additive risk factors contributed in CV complications through development of endothelial dysfunction, atherosclerosis, and vascular calcification. Indeed, VAT may act as a paracrine tissue mediating upregulation of adipocytokines (i.e adiponectin, leptin, vistafin), modulating inflammation that leads to insulin resistance and as a result to target-organ damage Luna-Luna et al., 2015. Moreover, VAT was identified as a potential source of OPG secretion de Ciriza et al., 2014Pérez de Ciriza et al., 2015. However, OPG plays a key role in progression of vasculopathy, asymptomatic atherosclerosis, and ectopic calcification in MetS acting as messenger of inflammatory and proliferative responses. It has been suggested that OPG might effect on subclinical disease and near-term CV events through suppression of repair ability of endothelium. Recently we have reported that patients with T2DM and MetS may be distinguished by predominantly appearing phenotypes of circulating endothelial- derived microparticles and progenitor cells associated with pro-inflammatory cytokine overproduction Berezin AE, 2015a, b. Although recent clinical studies have elucidated a closed association of serum OPG level with traditional (dyslipidemia, hypertension, obesity) and nontraditional (increased carotid-femoral pulse wave velocity, intima-media thickness, coronary artery calcification, hs-CRP, interleukin- 6, adiponectin) CV risk factors Ishiyama et al., 2009Moreno et al., 2013Nascimento et al., 2014, the relationship between OPG and angiogenic EPCs / MPCs remains to be yet not fully elucidated. Probably, OPG/RANK/sRANKL triad seems to be critical to the development of vascular reparation due to several mechanisms included inflammation and oxidative stress. Although a weak relation between OPG and hs- CRP, adiponectin was found, OPG was associated with greater decreased EPCs and MPCs odds. We did not exclude that OPG might act as transcriptional regulator via progenitor intracellular signal systems (extracellular signal-regulated kinase; c-Jun N-terminal kinase; focal adhesion kinase / p38 / mitogen-activated protein kinase signaling pathway) determined suppression of EPCs and MPCs ability to mobilization, differentiation, and proliferation Lee and Lorenzo, 2002. Furthermore, OPG could induce IR in progenitor cell subsets and thereby to limits their ability to proliferative response Acosta et al., 2015. Consequently, OPG could have an impact on impaired adipogenic capacity in progenitor cells and contributes in endiothelium damage. Overall, the exact impact of OPG on the mechanisms controlling progenitor cell homeostasis is poorly understood and required more investigations.
Recently, OPG was considered as a regulatory molecule with increased levels in the early stages of T2DM and atherosclerosis, and was also associated with IR. In this study we suggested that OPG as early independent predictor of depletion in angiopoetic endothelial and mononuclear progenitor cells might be useful for risk stratification of the MetS patients beyond CV risk factors. Moreover, scales of MetS severity and CV risk were not improved when serum OPG was added in the regression analysis that indicates the ability of this biomarker to reflect the contribution in other CV risk modulators. We also showed the clinical usefulness of implement of both scales in MetS at low CV risk when there was no known CV disease. Based on compelling evidences regarding the role of endothelial cell regeneration in from progenitor cells Singh et al., 2016 and the role of IR as CV risk factor Patel et al., 2016 we suggested that forming impaired phenotype affected angiopoetic progenitor cell subsets under possible influence of up-regulated OPG might be explain the role of OPG in vasculopathy among low CV risk MetS individuals. These findings probably open the perspective to use of serum OPG measurement as predictive biomarkers, whereas the discriminative capacity of OPG in this patient population requires to be more elucidated in further investigations.
Conclusion
Serum osteoprotegerin level was an independent predictor of depletion in angiopoetic EPCs and MPCs beyond classic CV risk factors in MetS patients without known CV disease.
Study limitations
Serum osteoprotegerin level was an independent predictor of depletion in angiopoetic EPCs and MPCs beyond classic CV risk factors in MetS patients without known CV disease.
Abbreviations
AUC - area under curve
BMI - body mass index
BNP - brain natriuretic peptide
CV - cardiovascular
MPCs - mononuclear progenitor cells
EPCs - endothelial progenitor cells
GFR - glomerular filtration rate
hs-CRP - high sensitive C-reactive protein
HDL-C - high-density lipoprotein cholesterol
LDL-C - low-density lipoprotein cholesterol
LVEF - left ventricular ejection fraction
sRANKL - serumreceptor activator of NF-κB ligand
Author Contributions
Alexander Berezin initiated the hypothesis and designed the study protocol, contributed to collect, analyze and interpret the data, performed statistical analysis, wrote the manuscript and approved final version of the paper. Alexander Kremzer enrolled the patients; collected and analyzed the data reviewed the source documents. Tatyana Berezina contributed to enroll the patients in the study and collected the data. Yulia Martovitskaya performed of cytofluorometry and interpreted of the obtained results. Elena Gromenko collected blood samples, contributed in cytofluorimetric assay of progenitor cells, performed biomarker assay, and interpreted of the obtained results. All authors read the manuscript before submitting and agree with final version of the paper.
References
-
J.R.
Acosta,
I.
Douagi,
D.P.
Andersson,
J.
Bäckdahl,
M.
Rydén,
P.
Arner,
J.
Laurencikiene.
Increased fat cell size: a major phenotype of subcutaneous white adipose tissue in non-obese individuals with type 2 diabetes. Diabetologia.
2015;
:
1-11
.
-
M.B.
Ahmed,
M.I.A.
Ismail,
A.-R.M.
Meki.
Relation of Osteoprotegerin, Visfatin and Ghrelin to Metabolic Syndrome in Type 2 Diabetic Patients. International journal of health sciences.
2015;
9
:
127
.
-
H.
Baumgartner,
A.
Ceriello,
R.
Fagard,
C.
Funck-Brentano,
D.C.
Gulba,
D.
Hasdai,
A.W.
Hoes.
ESC Guidelines on diabetes, pre-diabetes, and cardiovascular diseases developed in collaboration with the EASD-Summary. 2012
.
-
A.
Berezin.
Serum uric acid as a metabolic regulator of endothelial reparative processes in heart failure patients. Stem Cell and Translational Investigation.
2014;
1
.
-
K.A.
Berezin AE,
Martovitskaya YuV
Berezina TA.
Relationship between Numbers of Circulating Endothelial-Derived Progenitor Cells and Low Intensity Inflammation in Patients with Metabolic Syndrome and Diabetes Mellitus. Diabetes Res Treat.
2015a;
2
:
123-137
.
-
K.A.
Berezin AE,
Berezina TA
Samura TA.
Impaired immune phenotype of circulating endothelial-derived microparticles in patients with metabolic syndrome and diabetes mellitus. J Endocrinological Investigation.
2015b;
38
:
865-874
.
-
D.A.
Bluemke,
S.
Achenbach,
M.
Budoff,
T.C.
Gerber,
B.
Gersh,
L.D.
Hillis,
W.G.
Hundley,
W.J.
Manning,
B.F.
Printz,
M.
Stuber.
Noninvasive coronary artery imaging magnetic resonance angiography and multidetector computed tomography angiography: a scientific statement from the American Heart Association Committee on Cardiovascular Imaging and Intervention of the Council on Cardiovascular Radiology and Intervention, and the Councils on Clinical Cardiology and Cardiovascular Disease in the Young. Circulation.
2008;
118
:
586-606
.
-
A.F.
Cicero,
G.
Derosa,
M.
Manca,
M.
Bove,
C.
Borghi,
A.V.
Gaddi.
Vascular remodeling and prothrombotic markers in subjects affected by familial combined hyperlipidemia and/or metabolic syndrome in primary prevention for cardiovascular disease. Endothelium.
2007;
14
:
193-198
.
-
C.P.
Ciriza,
M.
Moreno,
P.
Restituto,
G.
Bastarrika,
I.
Simón,
I.
Colina,
N.
Varo.
Circulating osteoprotegerin is increased in the metabolic syndrome and associates with subclinical atherosclerosis and coronary arterial calcification. Clinical biochemistry.
2014;
47
:
272-278
.
-
M.D.
DeBoer,
M.J.
Gurka,
J.G.
Woo,
J.A.
Morrison.
Severity of the metabolic syndrome as a predictor of type 2 diabetes between childhood and adulthood: the Princeton Lipid Research Cohort Study. Diabetologia.
2015;
58
:
2745-2752
.
-
D.
Gordin,
A.
Soro-Paavonen,
M.C.
Thomas,
V.
Harjutsalo,
M.
Saraheimo,
M.
Bjerre,
C.
Forsblom,
A.
Flyvbjerg,
P.-H.
Groop,
F.S.
Group.
Osteoprotegerin is an independent predictor of vascular events in Finnish adults with type 1 diabetes. Diabetes Care.
2013;
36
:
1827-1833
.
-
S.M.
Grundy,
J.I.
Cleeman,
S.R.
Daniels,
K.A.
Donato,
R.H.
Eckel,
B.A.
Franklin,
D.J.
Gordon,
R.M.
Krauss,
P.J.
Savage,
S.C.
Smith.
Diagnosis and management of the metabolic syndrome an American Heart Association/National Heart, Lung, and Blood Institute scientific statement. Circulation.
2005;
112
:
2735-2752
.
-
S.M.
Grundy,
J.I.
Cleeman,
C.N.B.
Merz,
H.B.
Brewer,
L.T.
Clark,
D.B.
Hunninghake,
R.C.
Pasternak,
S.C.
Smith,
N.J.
Stone,
C.C.o.t.N.C.E.
Program.
A summary of implications of recent clinical trials for the National Cholesterol Education Program Adult Treatment Panel III guidelines. Arteriosclerosis, thrombosis and vascular biology.
2004;
24
:
1329-1330
.
-
N.I.o.
Health.
Third Report of the National Cholesterol Education Program Expert Panel on detection, evaluation, and treatment of high blood cholesterol in adults (Adult Treatment Panel III). Executive Summary Bethesda, MD, National Institutes of Health, National Heart, Lung and Blood Institute (NIH publ no 01-3670).
2001
.
-
L.C.
Hofbauer,
M.
Schoppet.
Clinical implications of the osteoprotegerin/RANKL/RANK system for bone and vascular diseases. Jama.
2004;
292
:
490-495
.
-
M.
Ishiyama,
E.
Suzuki,
J.
Katsuda,
H.
Murase,
Y.
Tajima,
Y.
Horikawa,
S.
Goto,
T.
Fujita,
J.
Takeda.
Associations of coronary artery calcification and carotid intima-media thickness with plasma concentrations of vascular calcification inhibitors in type 2 diabetic patients. Diabetes research and clinical practice.
2009;
85
:
189-196
.
-
S.
Jono,
Y.
Ikari,
A.
Shioi,
K.
Mori,
T.
Miki,
K.
Hara,
Y.
Nishizawa.
Serum osteoprotegerin levels are associated with the presence and severity of coronary artery disease. Circulation.
2002;
106
:
1192-1194
.
-
J.Y.
Kim,
Y.J.
Park,
K.J.
Kim,
J.J.
Choi,
W.U.
Kim,
C.S.
Cho.
Osteoprotegerin causes apoptosis of endothelial progenitor cells by induction of oxidative stress. Arthritis & Rheumatism.
2013;
65
:
2172-2182
.
-
S.
Kurl,
D.E.
Laaksonen,
S.Y.
Jae,
T.H.
Mäkikallio,
F.
Zaccardi,
J.
Kauhanen,
K.
Ronkainen,
J.A.
Laukkanen.
Metabolic syndrome and the risk of sudden cardiac death in middle-aged men. International journal of cardiology.
2016;
203
:
792-797
.
-
R.M.
Lang,
M.
Bierig,
R.B.
Devereux,
F.A.
Flachskampf,
E.
Foster,
P.A.
Pellikka,
M.H.
Picard,
M.J.
Roman,
J.
Seward,
J.S.
Shanewise.
Recommendations for chamber quantification: a report from the American Society of Echocardiography’s Guidelines and Standards Committee and the Chamber Quantification Writing Group, developed in conjunction with the European Association of Echocardiography, a branch of the European Society of Cardiology. Journal of the American Society of Echocardiography.
2005;
18
:
1440-1463
.
-
S.-H.
Lee,
H.K.
Yang,
H.-S.
Ha,
J.-H.
Lee,
H.-S.
Kwon,
Y.-M.
Park,
H.-W.
Yim,
M.-I.
Kang,
W.-C.
Lee,
H.-Y.
Son.
Changes in metabolic health status over time and risk of developing type 2 diabetes: a prospective cohort study. Medicine.
2015;
94
.
-
S.-K.
Lee,
J.
Lorenzo.
Regulation of receptor activator of nuclear factor-κB ligand and osteoprotegerin mRNA expression by parathyroid hormone is predominantly mediated by the protein kinase a pathway in murine bone marrow cultures. Bone.
2002;
31
:
252-259
.
-
A.S.
Levey,
L.A.
Stevens,
C.H.
Schmid,
Y.L.
Zhang,
A.F.
Castro,
H.I.
Feldman,
J.W.
Kusek,
P.
Eggers,
F.
Van Lente,
T.
Greene.
A new equation to estimate glomerular filtration rate. Annals of internal medicine.
2009;
150
:
604-612
.
-
W.
Lieb,
P.
Gona,
M.G.
Larson,
J.M.
Massaro,
I.
Lipinska,
J.F.
Keaney,
J.
Rong,
D.
Corey,
U.
Hoffmann,
C.S.
Fox.
Biomarkers of the osteoprotegerin pathway clinical correlates, subclinical disease, incident cardiovascular disease, and mortality. Arteriosclerosis, thrombosis and vascular biology.
2010;
30
:
1849-1854
.
-
M.
Luna-Luna,
A.
Medina-Urrutia,
G.
Vargas-Alarcón,
F.
Coss-Rovirosa,
J.
Vargas-Barrón,
Ó.
Pérez-Méndez.
Adipose tissue in metabolic syndrome: onset and progression of atherosclerosis. Archives of medical research.
2015;
46
:
392-407
.
-
G.
Mancia,
R.
Fagard,
K.
Narkiewicz,
J.
Redon,
A.
Zanchetti,
M.
Böhm,
T.
Christiaens,
R.
Cifkova,
G.
De Backer,
A.
Dominiczak.
2013 ESH/ESC guidelines for the management of arterial hypertension: the Task Force for the Management of Arterial Hypertension of the European Society of Hypertension (ESH) and of the European Society of Cardiology (ESC). Blood pressure.
2013;
22
:
193-278
.
-
D.
Matthews,
J.
Hosker,
A.
Rudenski,
B.
Naylor,
D.
Treacher,
R.
Turner.
Homeostasis model assessment: insulin resistance and β-cell function from fasting plasma glucose and insulin concentrations in man. Diabetologia.
1985;
28
:
412-419
.
-
P.R.
Moreno,
R.R.
Garcia,
A.
Garcia-Martin,
M.
Varsavsky,
J.
Garcia-Salcedo,
M.
Munoz-Torres.
Serum osteoprotegerin: Bone or cardiovascular marker in type 2 diabetes males?. Journal of endocrinological investigation.
2013;
36
:
16-20
.
-
T.
Morisawa,
A.
Nakagomi,
K.
Kohashi,
M.
Kosugi,
Y.
Kusama,
H.
Atarashi,
W.
Shimizu.
Osteoprotegerin is Associated With Endothelial Function and Predicts Early Carotid Atherosclerosis in Patients With Coronary Artery Disease. International heart journal.
2015
.
-
M.
Nascimento,
S.Y.
Hayashi,
M.
Riella,
B.
Lindholm.
Elevated levels of plasma osteoprotegerin are associated with all-cause mortality risk and atherosclerosis in patients with stages 3 to 5 chronic kidney disease. Brazilian Journal of Medical and Biological Research.
2014;
47
:
995-1002
.
-
Y.
Niu,
W.
Zhang,
Z.
Yang,
X.
Li,
J.
Wen,
S.
Wang,
H.
Zhang,
X.
Wang,
H.
Zhou,
W.
Fang.
Association of plasma osteoprotegerin levels with the severity of lower extremity arterial disease in patients with type 2 diabetes. BMC cardiovascular disorders.
2015;
15
:
1
.
-
C.S.
Palmer,
T.
Hussain,
G.
Duette,
T.J.
Weller,
M.
Ostrowski,
I.
Sada-Ovalle,
S.M.
Crowe.
Regulators of glucose metabolism in CD4+ and CD8+ T cells. International reviews of immunology.
2015;
:
1-12
.
-
T.P.
Patel,
K.
Rawal,
A.K.
Bagchi,
G.
Akolkar,
N.
Bernardes,
D.
da Silva Dias,
S.
Gupta,
P.K.
Singal.
Insulin resistance: an additional risk factor in the pathogenesis of cardiovascular disease in type 2 diabetes. Heart failure reviews.
2016;
21
:
11-23
.
-
C.
Pérez de Ciriza,
A.
Lawrie,
N.
Varo.
Osteoprotegerin in Cardiometabolic Disorders. International journal of endocrinology 2015.
2015
.
-
D.
Preiss,
S.L.
Kristensen.
The New Pooled Cohort Equations Risk Calculator. Canadian Journal of Cardiology.
2015;
31
:
613-619
.
-
E.-J.
Rhee,
M.K.
Lee,
J.D.
Kim,
W.S.
Jeon,
J.C.
Bae,
S.E.
Park,
C.-Y.
Park,
K.-W.
Oh,
S.-W.
Park,
W.-Y.
Lee.
Metabolic health is a more important determinant for diabetes development than simple obesity: a 4-year retrospective longitudinal study. PloS one.
2014;
9
:
e98369
.
-
E.-J.
Rhee,
M.H.
Seo,
J.D.
Kim,
W.S.
Jeon,
S.E.
Park,
C.-Y.
Park,
K.- W.
Oh,
S.-W.
Park,
W.-Y.
Lee.
Metabolic health is more closely associated with coronary artery calcification than obesity. PLoS One.
2013;
8
:
e74564
.
-
G.P.
Rodgers,
J.Z.
Ayanian,
G.
Balady,
J.W.
Beasley,
K.A.
Brown,
E.V.
Gervino,
S.
Paridon,
M.
Quinones,
R.C.
Schlant,
W.L.
Winters.
American College of Cardiology/American Heart Association Clinical Competence statement on stress testing: a report of the American College of Cardiology/American Heart Association/American College of Physicians—American Society of Internal Medicine Task Force on Clinical Competence. Journal of the American College of Cardiology.
2000;
36
:
1441-1453
.
-
N.
Sattar,
A.
Gaw,
O.
Scherbakova,
I.
Ford,
D.S.J.
O’Reilly,
S.M.
Haffner,
C.
Isles,
P.W.
Macfarlane,
C.J.
Packard,
S.M.
Cobbe.
Metabolic syndrome with and without C-reactive protein as a predictor of coronary heart disease and diabetes in the West of Scotland Coronary Prevention Study. Circulation.
2003;
108
:
414-419
.
-
J.
Scholze,
E.
Alegria,
C.
Ferri,
S.
Langham,
W.
Stevens,
D.
Jeffries,
K.
Uhl- Hochgraeber.
Epidemiological and economic burden of metabolic syndrome and its consequences in patients with hypertension in Germany, Spain and Italy; a prevalence-based model. BMC Public Health.
2010;
10
:
1
.
-
A.
Schuhbaeck,
Y.
Otaki,
S.
Achenbach,
C.
Schneider,
P.
Slomka,
D.S.
Berman,
D.
Dey.
Coronary calcium scoring from contrast coronary CT angiography using a semiautomated standardized method. Journal of cardiovascular computed tomography.
2015;
9
:
446-453
.
-
H.
Singh,
V.
Parthasarathy,
M.
Farouk,
V.
Venkatesan.
Progenitor cells may aid successful islet compensation in metabolically healthy obese individuals. Medical hypotheses.
2016;
86
:
97-99
.
-
G.
Tocci,
A.
Ferrucci,
G.
Bruno,
E.
Mannarino,
G.
Nati,
B.
Trimarco,
M.
Volpe.
Prevalence of metabolic syndrome in the clinical practice of general medicine in Italy. Cardiovascular diagnosis and therapy.
2015;
5
:
271
.
-
D.
Tousoulis,
G.
Siasos,
K.
Maniatis,
E.
Oikonomou,
S.
Kioufis,
M.
Zaromitidou,
T.
Paraskevopoulos,
S.
Michalea,
C.
Kollia,
A.
Miliou.
Serum osteoprotegerin and osteopontin levels are associated with arterial stiffness and the presence and severity of coronary artery disease. International journal of cardiology.
2013;
167
:
1924-1928
.
-
J.W.
Tung,
D.R.
Parks,
W.A.
Moore,
L.A.
Herzenberg,
L.A.
Herzenberg.
New approaches to fluorescence compensation and visualization of FACS data. Clinical Immunology.
2004;
110
:
277-283
.
-
A.
Van Campenhout,
J.
Golledge.
Osteoprotegerin, vascular calcification and atherosclerosis. Atherosclerosis.
2009;
204
:
321-329
.
-
S.M.
Venuraju,
A.
Yerramasu,
R.
Corder,
A.
Lahiri.
Osteoprotegerin as a predictor of coronary artery disease and cardiovascular mortality and morbidity. Journal of the American College of Cardiology.
2010;
55
:
2049-2061
.
-
S.
Vitovski,
J.S.
Phillips,
J.
Sayers,
P.I.
Croucher.
Investigating the Interaction between Osteoprotegerin and Receptor Activator of NF-κB or Tumor Necrosis Factor-related Apoptosis-inducing Ligand Evidence For A Pivotal Role For Osteoprotegerin In Regulating Two Distinct Pathways. Journal of Biological.
2007;
Chemistry282
:
31601-31609
.
-
M.
Volpe,
A.
Battistoni,
G.
Tocci,
E.A.
Rosei,
A.L.
Catapano,
R.
Coppo,
S.
del Prato,
S.
Gentile,
E.
Mannarino,
S.
Novo.
Cardiovascular risk assessment beyond systemic coronary risk estimation: a role for organ damage markers. Journal of hypertension.
2012;
30
:
1056-1064
.
-
M.
Walczak,
J.
Suraj,
K.
Kus,
A.
Kij,
A.
Zakrzewska,
S.
Chlopicki.
Towards a comprehensive endothelial biomarkers profiling and endothelium-guided pharmacotherapy. Pharmacological Reports.
2015;
67
:
771-777
.
Comments
Downloads
Article Details
Volume & Issue : Vol 3 No 02 (2016)
Page No.: 501-513
Published on: 2016-02-25
Citations
Copyrights & License
This work is licensed under a Creative Commons Attribution 4.0 International License.
Search Panel
Pubmed
Google Scholar
Pubmed
Google Scholar
Pubmed
Google Scholar
Pubmed
Google Scholar
Pubmed
Search for this article in:
Google Scholar
Researchgate
- HTML viewed - 3126 times
- Download PDF downloaded - 1047 times
- View Article downloaded - 5 times
