

Comparison of molecular signatures in large scale protein interaction networks in normal and cancer conditions of brain, cervix, lung, ovary and prostate
Copyrights: Rajat Suvra Banik, Md Shaifur Rahman, K M Taufiqur Rahman, Md Fahmid Islam, Sheikh Md Enayetul Babar, 2016. License: This work is licensed under a Creative Commons Attribution 4.0 International License.
Abstract
Background
Cancer, the disease of intricateness, has remained beyond our complete perception so far. Network systems biology (termed NSB) is one of the most recent approaches to understand the unsolved problems of cancer development. From this perspective, differential protein networks (PINs) have been developed based on the expression and interaction data of brain, cervix, lung, ovary and prostate for normal and cancer conditions.
Methods
Differential expression database GeneHub-GEPIS and interaction database STRING were applied for primary data retrieval. Cytoscape platform and related plugins named network analyzer; MCODE and ModuLand were used for visualization of complex networks and subsequent analysis.
Results
Significant differences were observedamong different common network parameters between normal and cancer states. Moreover, molecular complex numbers and overlapping modularization found to be varying significantly between normal and cancerous tissues. The number of the ranked molecular complex and the nodes involved in the overlapping modules were meaningfully higher in cancer condition.We identified79 commonly up regulated and 6 down regulated proteins in all five tissues. Number of nodes, edges; multi edge node pair, and average number of neighbor are found with significant fluctuations in case of cervix and ovarian tissues.Cluster analysis showed that the association of Myc and Cdk4 proteins is very close with other proteins within the network.Cervix and ovarian tissue showed higher increment of the molecular complex number and overlapping module network during cancer in comparison to normal state.
Conclusions
The differential molecular signatures identified from the work can be studied further to understand the cancer signaling process, and potential therapeutic and detection approach.
Introduction
Cancer is an abnormal manifestation caused by the process of tumorigenesis due to the mutation in oncogenes and tumor suppressor genes. Mutation produces chromosomal aberration, genomic and proteomic instability and finally, abnormal proliferation and differentiation. Different methods such as clonal genetic model, epigenetic model and cancer stem cell model tried to uncover the complicatedness of cancer Shackleton et al., 2009. However, most of these approaches bring little satisfactory results to unfold cancer completely. The stochastic nature of cancer initiation requires the dynamic approach to endue their non-linear function resulting in the alternation at both genomic and proteomic level Bizzarri and Cucina, 2014. Notably, cancer forms an extreme interactive complexity and progresses due to the association of multiple interactions of numerous constituents of cells and tissues Sonnenschein et al., 2014. The interconnection gene map uncovered significant interconnectivity between known and candidate cancer gene products, providing unbiased evidence for an expanded functional cancer landscapewhile demonstrating how high-quality interaction models will help “connect the dots” of the genomic revolution Rolland et al., 2014. And the tremendous work of Cancer Genome Atlas Research Network (http://cancergenome.nih.gov/) opens a new era to develop therapy against cancer by mapping the genetic changes in 20 cancers. An integrative study like NSB could be a better way to understand the intricate pattern of cancer. Comparative analysis of changes in protein-protein interaction (PPI) network’s features between normal and cancer condition can be a handy tool to decipher the conversion of a normal cell into a cancer one Islam et al., 2013. Generally, bimolecular networks divide into modules according to the concentration of the nodes in the network. The modules are the subsets of the network that indicate the connectedness among the nodes within the module through edges. The nodes involved in a module are highly connected with each other Rives and Galitski,2003. Importantly, the identification of such modules in a network is essential to understand the structural and functional features of a network Barabási et al., 2011.
However, pharmaceutical bioinformatics is impending towards in silico molecular target analysis and developing computational tools for delineating the concept of modern therapeutics. As a result, cancer-specific PPI network scanning can serve as candidates of drug target for developing novel cancer therapy Jeon et al., 2014. The objective of our work was to analyze the complex differential PPI networks in normal and cancer condition of brain, cervix, lung, ovary and prostate. Our analysis based on the gene expression and interaction data for the proteins involved in cancer signaling pathways. MCODE was used to find the highly interconnected regions (clusters) of the networks Stevens et al., 2014. Another method ModuLand was used for identification of the hierarchical layers of overlapping modules and crucial nodes of the networks Szalay-Beko et al., 2012. Tissue-specific networks analysis methods can be used to predict lineage- specific responses to uneasiness, identify the changing functional roles of genes expression across tissues and brighten relationships among diseases Greene et al., 2015. In contrast with tissue-naive networks and cancer, which help to assume that the function of genes across tissues, these maps can answer biological questions that are specific to a single gene in a single tissue.
Materials and methods
Data retrieval
Cancer cell map database PC (http://www.pathwaycommons.org/pc/home.do) was used to make a list of protein molecules involved in major cancer signal transduction pathways Cerami et al., 2010. We considered ten major signal transduction pathways are α-6-β-4-integrin, androgen receptor, kit receptor, Egfr1, Hh, Wnt, Id, Notch, TgfβR and Tnfα/NF-kB. Expression of different protein molecules in both normal and cancer condition for selected tissues was accumulated byGeneHub-GEPIS (http://researchpulic.gene.com/Research/genentech/genehubgepis/index.html) Zhang et al., 2007.
Construction and analysis of differential networks
Possible PPIs was studied through STRING (http://string.embl.de/) (Mering, 2003). Differential protein expression of selected tissues for normal and cancer state were studied using GeneHub-GEPIS. Java programming language was used to determine the valid interactions by using Textpad 4.42 version. In that case, expressed proteins were assigned value 1 and unexpressed proteins were assigned value 0. Then binary calculation was utilized to determine the valid interactions. Only 1+1=1 represents valid interaction and 1+0=0, 0+1=0, 0+0=0 denotes invalid interactions. In the algorithm, the interaction is stated as yes (1) or no (0). From the biophysics point of view, this is a bold simplification. We understand that this is the common use in this strategy but a comment indicating that reality is more complicated is also necessary. We also performed a weight for the interaction strength which indeed a good option (Data not shown). Cytoscape 2.8.3 version was used to construct the PPI networks for both normal and cancer condition for the tissues. Network analyzer, a plugin of Cytoscapesoftware package was used to analyze the simple network parameters Shannon, 2003.
Identification of common cluster in PPI networks
The protein expressions were studied to determine whether they are up-regulated or down-regulated during transformation into cancer state from normal one. The proteins that were commonly up-regulated and down-regulated in all studied tissues during cancer condition were identified. Their relevant interactions were identified; while commonly downregulated proteins were ignored (contributions of only six commonly down-regulated proteins were negligible). We used the computational methods as described by Rahman et al.,2013 Rahman et al., 2013. In brief, Microsoft Excel 2010 was used to subtract normal condition expression (digital expression unit) value from cancer condition expression of signaling proteins and TextPad 4.42 version was used to code in JAVA programming language to isolate up-regulated proteins from down-regulated one. Interactions within these commonly up-regulated proteins during cancer condition were depicted in networks constructed with Cytoscape 2.8.3 version Smoot et al., 2010. Using the human PPI network as a backbone, Srihari and Ragan, 2013 infer two tissue condition-specific PPI networks, one for normal and one for tumor, by incorporating expression and mutation profiles of genes in the two conditions, they systematically tracking of dysregulated modules and identified novel genes in cancer.
Network modularity analysis
Module discovery in biological networks has been extremely powerful for elucidating molecular machinery underlying physiological and disease phenotypes. Numerous approaches have been advanced to mine such networks for identifying biological modules, including methods for clustering interactions and those based on topological features of the network such as degree and betweenness centrality Mitra et al., 2013.
Briefly, MCODE and ModuLandcytoscape plugins were used to analyze network modularity Bader and Hogue, 2003Szalay-Beko et al., 2012. One hand MCODE needed to detect molecular complexes those were the densely connected regions in protein interaction network. On other hand,ModuLandwas used to determine the overlapping network modules. Unweighted network option was used with default value 1 to create correlation matrix and module correlation histogram. The graph related parameters were studied by the measure option of ModuLand.
Results and discussion
Network analyzer study
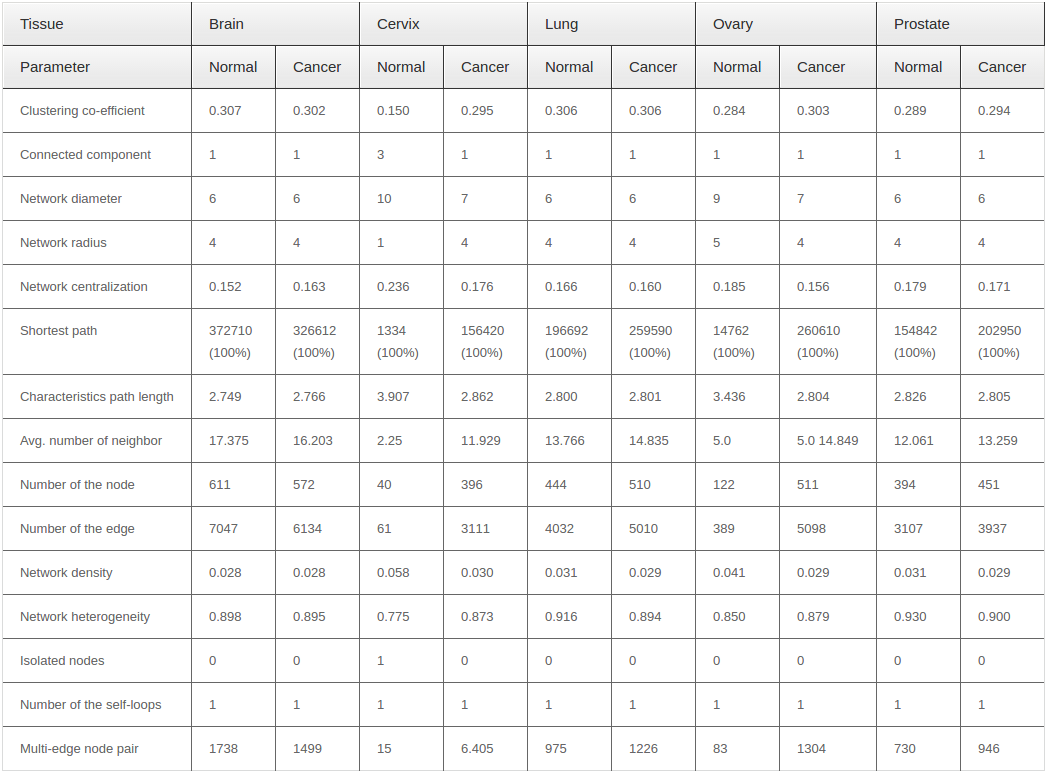
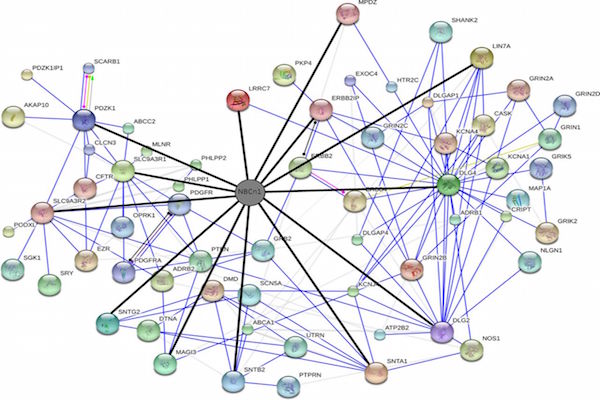
Primarily we analyzed the PINs for the brain, cervix, lung, ovary and prostate tissue in both normal and cancer conditions. We observed some fluctuations in the parameters during cancer condition comparison to normal ones.Anumber of nodes, number of edges, multi-edge node pair, and average number of neighbor are higher in all five tissues in cancer condition. Interestingly, significant fluctuations in different parameter found in case of cervix and ovarian tissues. Figure 1 ( 1A and 1B ) represents the biolayout of protein interaction network for ovary and cervix in normal and cancer condition. These changes indicated the strengthening of modules possibly abetting cancer. All other biolayout of protein interaction networks were shown in Supplementary file S1 (S1a1, S1a2; S1b1, S1b2; S1c1, S1c2). Srihari and Ragan, 2013 performed a straightforward systematic identification and comparison of modules across pancreatic normal and cancer tissue conditions by integrating PPI and gene-expression data. They found some modules showed differences in gene regulation to prompt pancreatic and breast cancer. However, genomic alterations in lung cancers have not been comprehensively characterized, and no molecularly targeted agents have been specifically developed yet. Notably, the Cancer Genome Atlas Research Network analyzed squamous cell lung cancers and found statistically recurrent mutations in 11 genes, including mutation of TP53. They discovered loss-of-function mutations in the HLA-A class I MHC gene. Additionally TCGA identified significantly altered pathways included NFE2L2, KEAP1, phosphatidylinositol-3-OH kinase, CDKN2A and RB1 Willett et al., 2013.
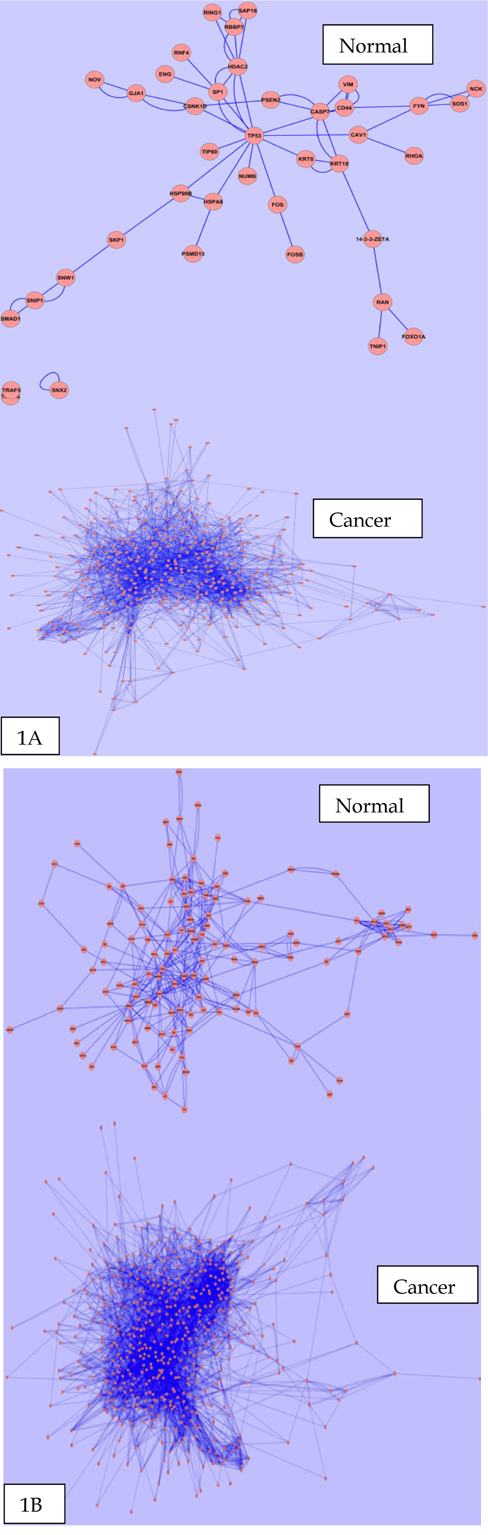
From our network analyzer data, it is a clear indication that there may be some candidate proteins which are responsible for the abnormal proliferation in cancer, and are not able to be expressed in normal condition. On the other hand, network density and characteristics path length are always lower in cancer condition for all five tissues. However, it is also revealed that the nodes within the networks are more connected to each other and form clusters in cancer condition. Other network parameters also have shown different degree of fluctuation during cancer condition in comparison to normal state. List of common network parameters for both the normal and cancerous condition showed in Table 1 .
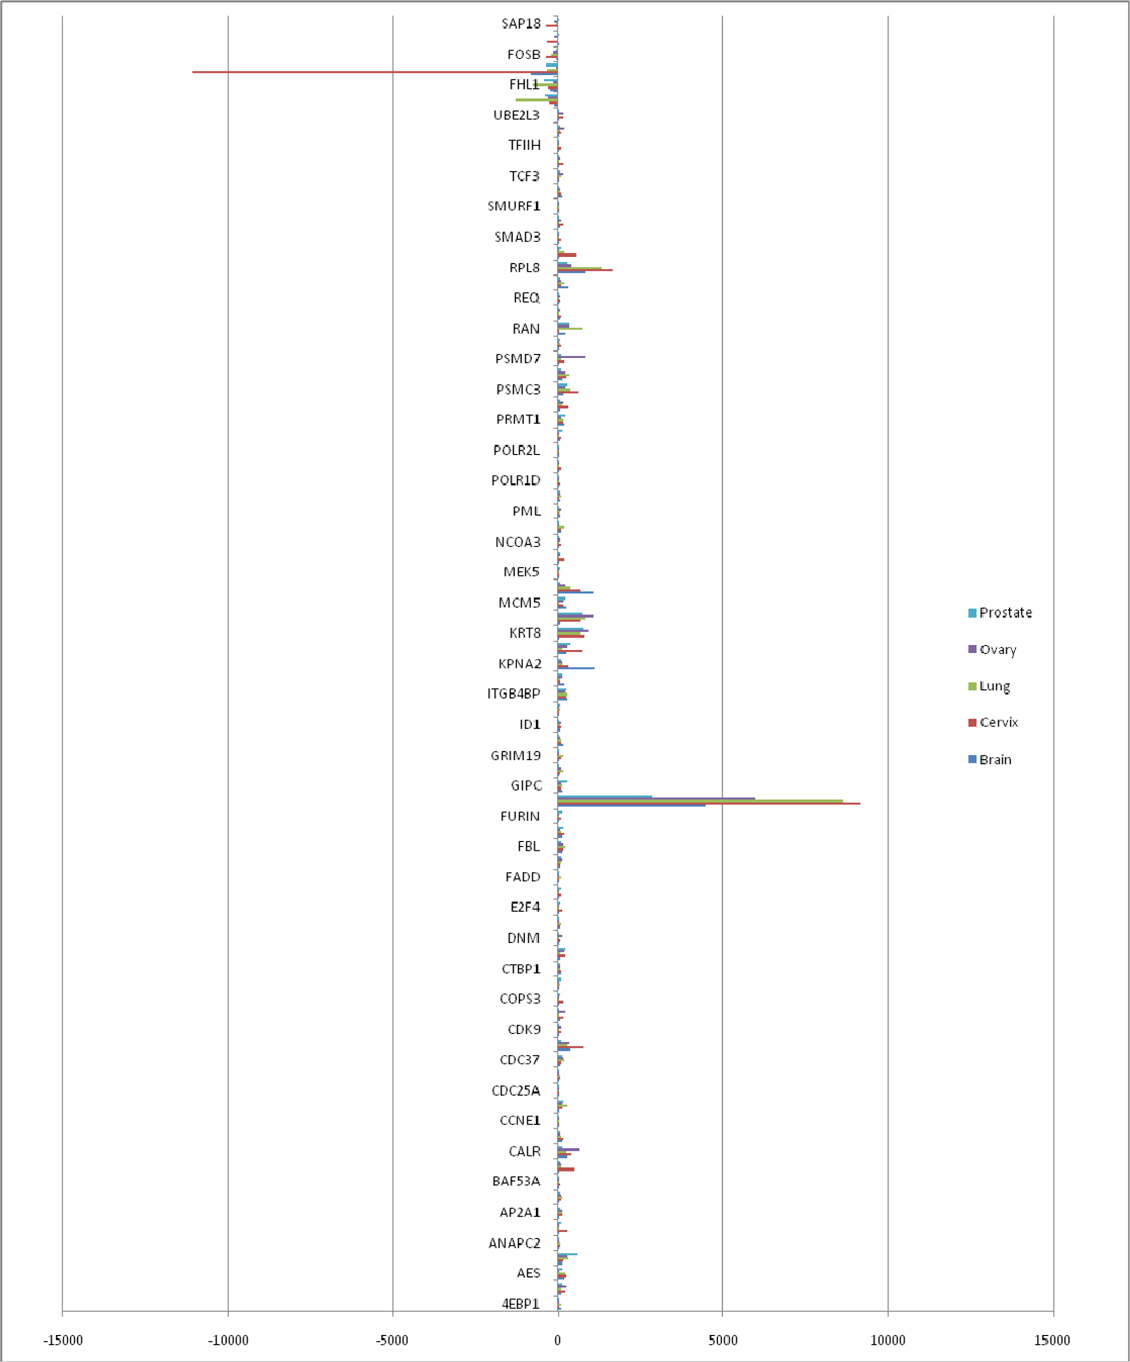
We analyzed the up-regulated and down-regulated proteins in cancer condition from the expression data (Supplementary file S2: S2a and S2b). We found 79 commonly up-regulated and 6 commonly downregulated proteins in all five tissues ( Figure 2 ). Eng, FHL1, FO5, FOSB, MITF and SAP1B were the commonly down-regulated genes. However, the Cancer Genome Atlas Network characterized somatic alterations in colorectal cancer of 276 specimens. They found silencing of MLH1 and polymerase e (POLE) due to hypermutation, and mutated version of APC, TP53, SMAD4, PIK3CA, KRAS, ARID1A, SOX9 and FAM123B Network, 2012. TCGA Integrative analyzes suggest new markers for aggressive colorectal carcinoma and an important role for MYC-directed transcriptional activation and repression.
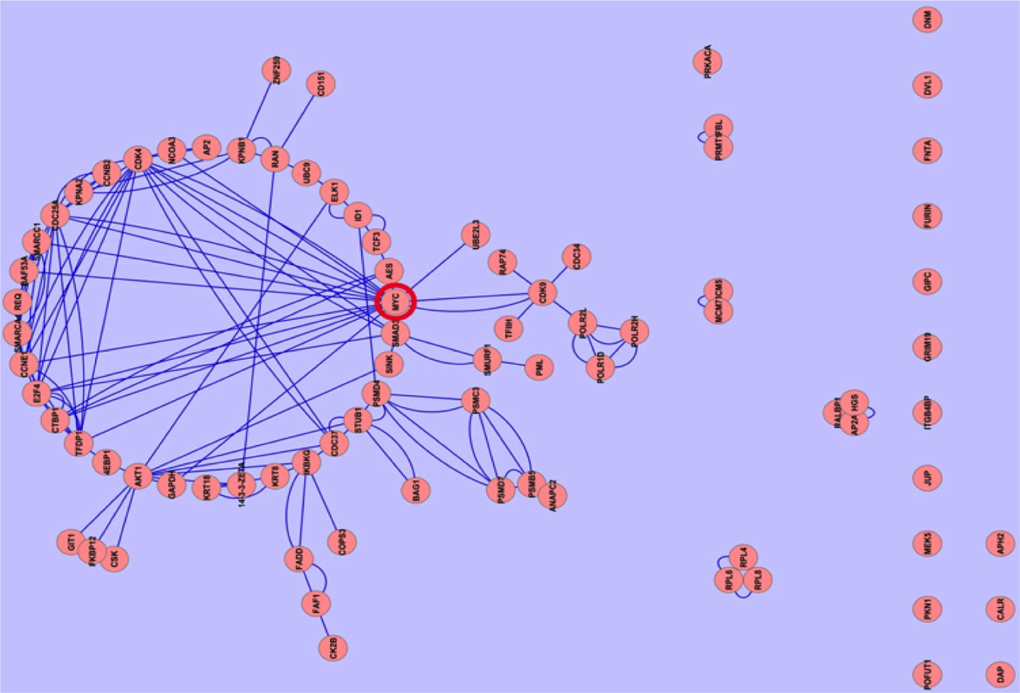
In our studied samples, the commonly downregulated proteins were very few in number, we ignored them. The network of commonly 79 upregulated proteins forms a cluster within the network. Cluster analysis showed that the association of MYC and CDK4 proteins is very close with other proteins within the network ( Figure 3 ). The association of c-MYC and CDK4 proteins has actually been well known from in vivo experiment Lapenna and Giordano, 2009. Moreover, Myc and Cdk4 is also well established therapeutic target in studying different cancers Choi, 2011, but the different forms of MYC (n- and lmyc) yet to know. It is crucial that MYC plays important role in cancer progression by inactivating the checkpoints protein such as p53. MYC also activates ribosomal and mitochondrial biogenesis, glucose metabolism, glutamine metabolism, lipid synthesis, cell cycle progression which is responsible for cancer cell growth Miller et al., 2012Tansey,2014. Independently p21 can promote oncogenesis by promoting the assembly of complexes of cyclin D with Cdk4 Abbas and Dutta, 2009. Aberrant expression of the cell cycle associated protein cdk4 in cervical carcinomas Skomedal et al., 1999. The growth of BG-1 ovarian cancer cells is promoted by via up-regulation of Cdk4 genes Choi, 2011. MYC and Cdk4 are well-known drug target against cancer Hermeking, 2003Lapenna and Giordano, 2009.
Molecular complex detection
Molecular complex detection (MCODE) method has been used to detect possible modules that could be said as molecular complexes. Nevertheless, the rank molecules are in a consecutive order as per their score value where the number of molecular complexes is varied between normal and cancer condition. In all cases, possible molecular complex numbers are higher in cancer condition except the brain. Molecular complex number is significantly increased (at p-value≤ 0.05) between normal and cancer conditions (Supplementary file S3). Similar result was also found in previous studies (at p-value ≤ 0.05) of Islam et al.,2013. The ranked molecular complex numbers of normal and cancer protein interaction networks are 35 and 31 for brain, 6 and 30 for cervix, 24 and 30 for lung, 14 and 33 for ovary and 14 and 25 for prostate, respectively. However, cervix and ovarian cancer showed higher increment of the molecular complex number during cancer in comparison to normal state ( Figure 4 ). All other tissues molecular complex data has been represented in Supplementary 4 (S4a1, S4a2; S4b1, S4b2; S4c1, S4c2). The Cancer Genome Atlas project (TCGA) has analyzed 805 highgrade serous ovarian cancer and found TP53 mutations in nearly all; several genes mutated at lower frequencies including NF1, BRCA1, BRCA2, RB1 and CDK12; and reported NOTCH and FOXM1 signaling are involved in serous ovarian cancer Network, 2012. Additionally, TCGA network identified 22 genes for which inhibitors already exist were identified in regions of recurrent amplification.
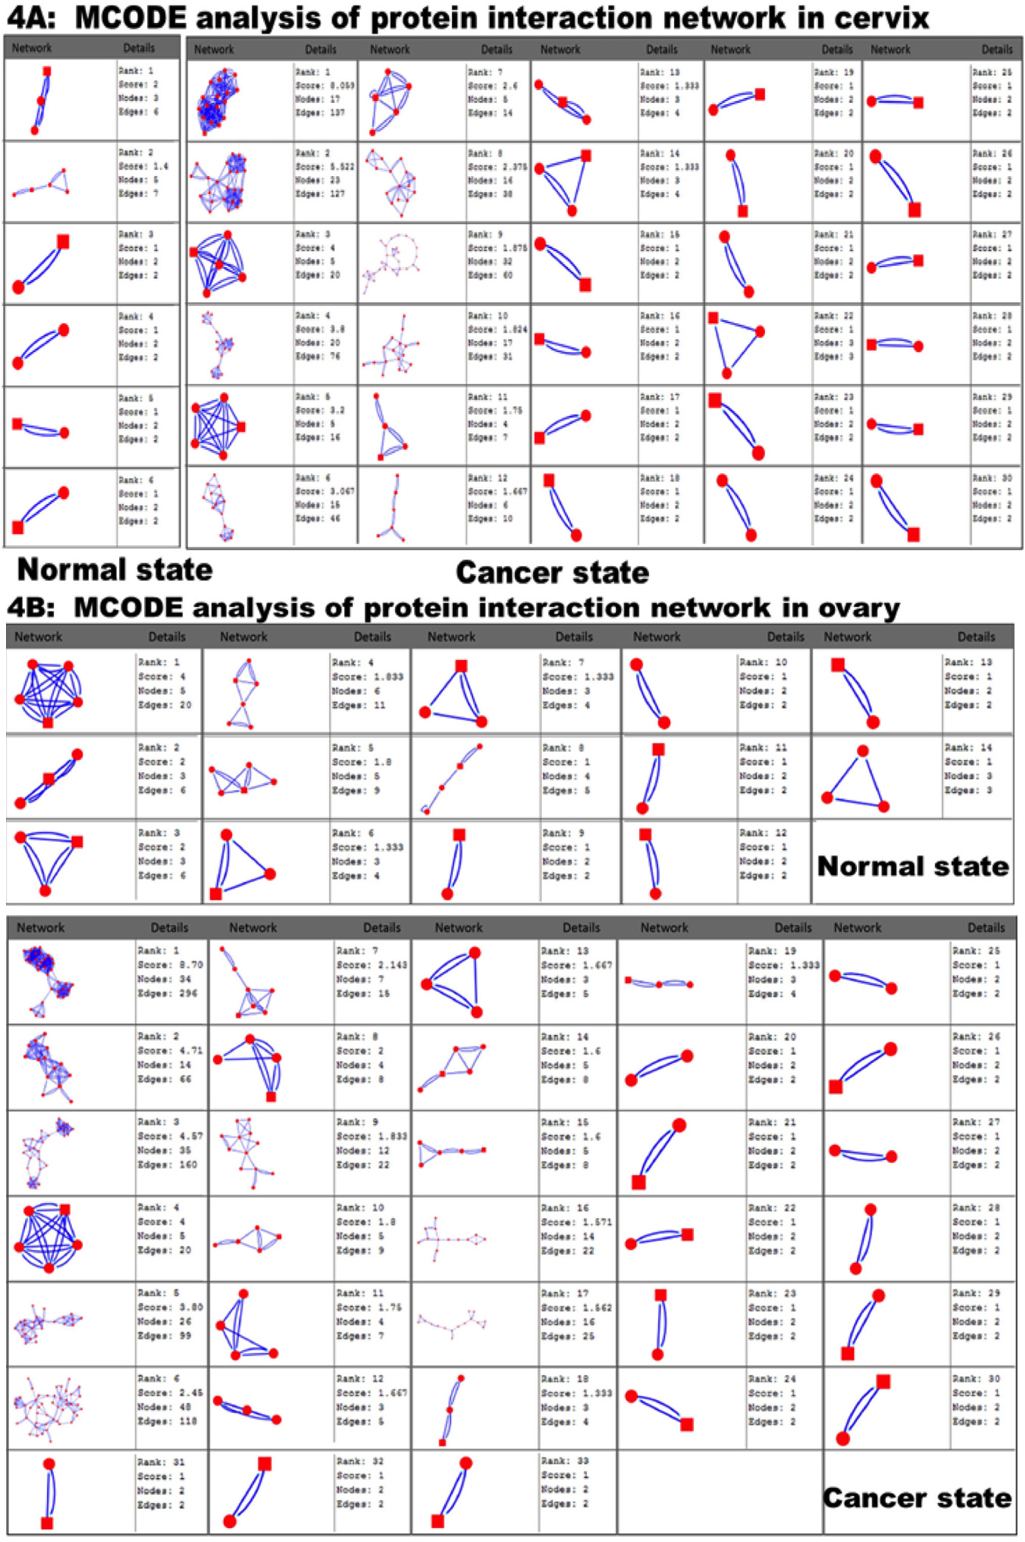
In our MCODE analysis parameters e.g. scores, nodes and edges of the molecular complex networks are also varied between normal and cancer condition for each tissue. It has already been identified that disease genes show higher degree of connectivity in comparison to non-disease genes in the cases of expression and interaction of proteins Jonsson and Bates, 2006. Moreover, some studies also indicate that in cancer condition the protein shows higher degree of connectivity in comparison to normal state Sun and Zhao,2010.
ModuLand study
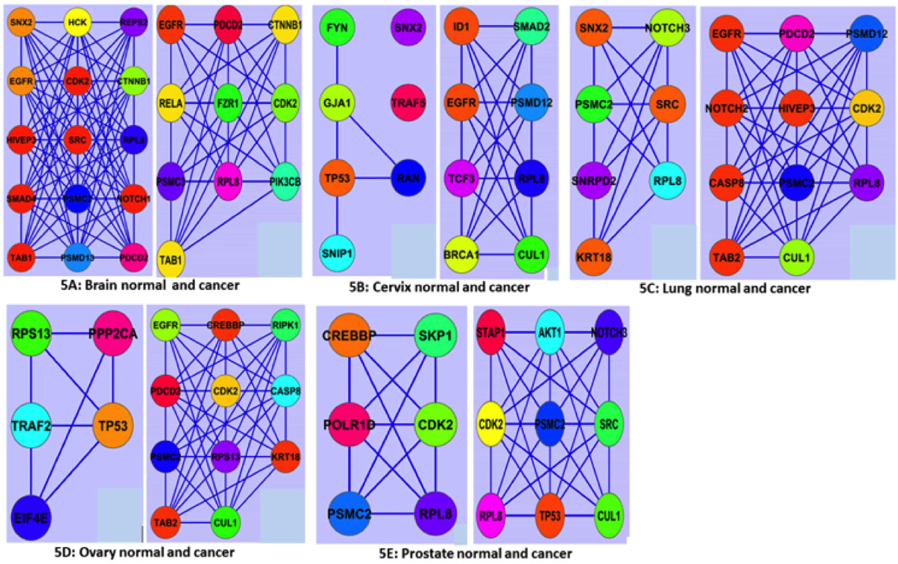
Discovery of active modules has shown the way for diagnostic and therapeutic interventions. For instance, active modules showing the patterns of gene expression correlated with specific disease phenotypes can help to develop valuable biomarkers for disease classification Mitra et al., 2013. However, our ModuLand study showed thatoverlapping modules between normal and cancer states were different for all five tissues ( Figure 5 ). In the brain, numbers of nodes and edge forming the overlapping networks were decreased in cancer condition ( Figure 5A ). But, in other cases, the node and the edge number forming the overlapping network were increased. The highest fluctuation of overlapping module occurs in case of ovary ( Figure 5D ). In ovary, the number of nodes forming the overlapping module was 5 in normal tissue and 11 in cancer. The nodes of the overlapping module can be said as the crucial nodes with module centrality of the respective network. The important network properties of the overlapping modules were also shownthedifferent degree of fluctuation, which has been compared (Supplementary file S5: S5a1, S5a2; S5b1, S5b2; S5c1, S5c2; S5d1, S5d2; S5e1, S5e2). Module-based biomarkers achieve greater predictive power and reproducibility over single gene markers, as demonstrated for the classification of several forms of cancers including breast cancers Chuang et al., 2007, ovarian cancer Bapat et al., 2010 and glioblastomas Miller et al., 2011. Because active modules can reveal pathwaycentric insights reinforced by multiple lines of evidence, they naturally provide mechanistic explanations for complex traits and multi-genic diseases like cancer. Moreover, active modules can assist in the discovery of drug-target pathways and in predicting response to chemotherapy.
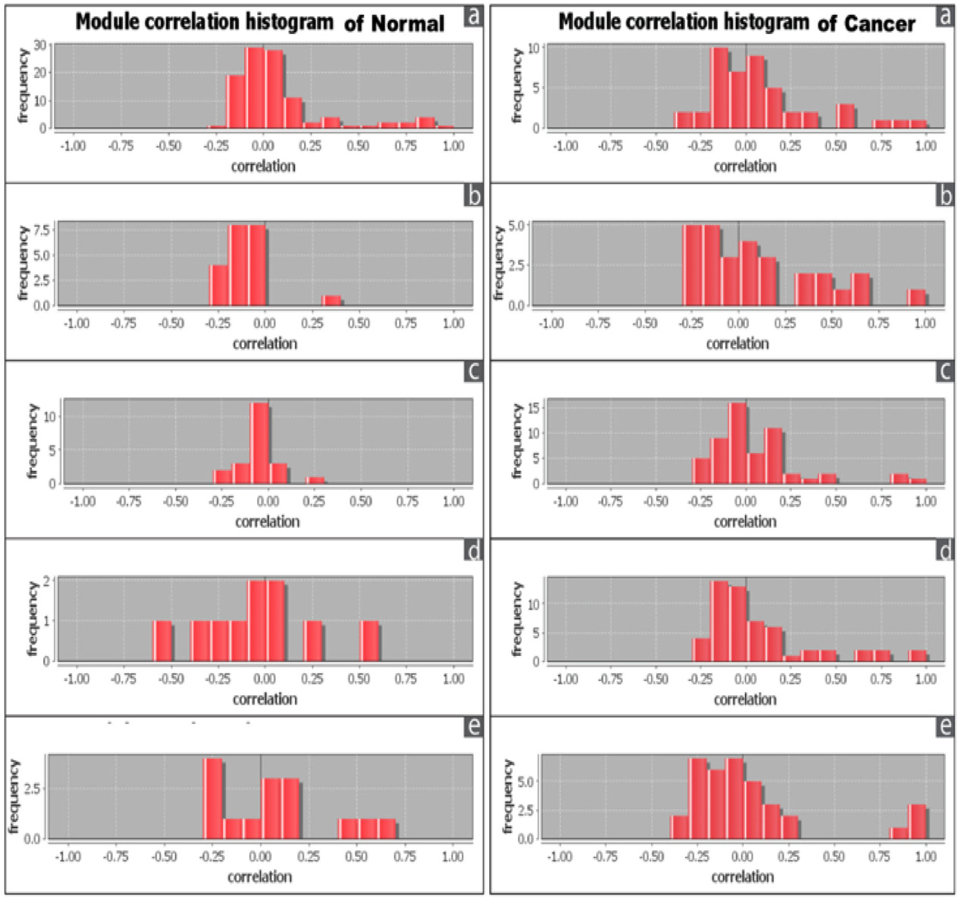
The correlation among the nodes of the overlapping modules was represented by correlation matrix and correlation histogram. Correlation matrix represents possible interactions of the overlapping modules at a certain threshold level (here 1.0). Correlation matrix (Supplementary file S6: S6a1, S6a2; S6b1, S562; S6c1, S6c2; S6d1, S562; S6e1, S6e2) and histogram indicate that the nodes of overlapping modules show different degree of interaction in normal and cancer condition ( Figure 6 ). Number of the nodes involved in overlapping modules is significantly increased (at p-value≤ 0.01) between normal and cancer conditions in all five tissues except brain (Supplementary file S7).
This study speculates cancer associated complexes which are real biologically functional units and leads us to stride on the biological reality. However, our comprehensive network modularity analysis can address the molecular signatures which can be the promising candidates of drug target for cancer therapy. The network modularity robustness, on the other hand, can provide a new paradigm to understand the relationship between cellular networks and cancer demeanors. In our study, brain shows different results in both detection of molecular complex and detection of overlapping modules.
Unlike other tissues, number of ranked molecular complexes and nodes involved in the overlapping module are lower in cancer condition. Intriguingly, cancers having the protein interaction networks of lower molecular complex with less modular signaling are more curable than others. Here we considered commonly used un-weighted and static network which may lower its reliability to understand the real the dynamic physical nature of living tissues. The further expedition is required for better understanding of the networking level of biological processes of cancer.
References
-
T.
Abbas,
A.
Dutta.
p21 in cancer: intricate networks and multiple activities. Nature Reviews Cancer.
2009;
9
:
400-414
.
-
G.D.
Bader,
C.W.
Hogue.
An automated method for finding molecular complexes in large protein interaction networks. BMC bioinformatics.
2003;
4
:
1
.
-
S.A.
Bapat,
A.
Krishnan,
A.D.
Ghanate,
A.P.
Kusumbe,
R.S.
Kalra.
Gene Expression: Protein Interaction Systems Network Modeling Identifies Transformation-Associated Molecules and Pathways in Ovarian Cancer. Cancer Research.
2010;
70
:
4809-4819
.
-
A.-L.
Barabási,
N.
Gulbahce,
J.
Loscalzo.
Network medicine: a network-based approach to human disease. Nat Rev Genet.
2011;
12
:
56-68
.
-
M.
Bizzarri,
A.
Cucina.
Tumor and the Microenvironment: A Chance to Reframe the Paradigm of Carcinogenesis?. BioMed Research International.
2014;
2014
:
1-9
.
-
E.G.
Cerami,
B.E.
Gross,
E.
Demir,
I.
Rodchenkov,
O.
Babur,
N.
Anwar,
N.
Schultz,
G.D.
Bader,
C.
Sander.
Pathway Commons, a web resource for biological pathway data. Nucleic Acids Research.
2010;
39
:
D685-D690
.
-
K.-C.
Choi.
Cell growth of BG-1 ovarian cancer cells is promoted by di-nbutyl phthalate and hexabromocyclododecane via upregulation of the cyclin D and cyclin-dependent kinase-4 genes. Molecular Medicine Reports.
2011
.
-
H.-Y.
Chuang,
E.
Lee,
Y.-T.
Liu,
D.
Lee,
T.
Ideker.
Networkbased classification of breast cancer metastasis. Mol Syst Biol.
2007;
3
.
-
C.S.
Greene,
A.
Krishnan,
A.K.
Wong,
E.
Ricciotti,
R.A.
Zelaya,
D.S.
Himmelstein,
R.
Zhang,
B.M.
Hartmann,
E.
Zaslavsky,
S.C.
Sealfon.
Understanding multicellular function and disease with human tissuespecific networks. Nature Genetics.
2015;
47
:
569-576
.
-
H.
Hermeking.
The MYC Oncogene as a Cancer Drug Target. Current Cancer Drug Targets.
2003;
3
:
163-175
.
-
M.
Islam,
M.
Hoque,
R.
Banik,
S.
Roy,
S.
Sumi,
F.M.
Hassan,
M.T.
Tomal,
A.
Ullah,
K.M.
Rahman.
Comparative analysis of differential network modularity in tissue specific normal and cancer protein interaction networks. J Clin Bioinformatics.
2013;
3
:
19
.
-
J.
Jeon,
S.
Nim,
J.
Teyra,
A.
Datti,
J.L.
Wrana,
S.S.
Sidhu,
J.
Moffat,
P.M.
Kim.
A systematic approach to identify novel cancer drug targets using machine learning, inhibitor design and high-throughput screening. Genome Medicine.
2014;
6
:
57
.
-
P.F.
Jonsson,
P.A.
Bates.
Global topological features of cancer proteins in the human interactome. Bioinformatics.
2006;
22
:
2291-2297
.
-
S.
Lapenna,
A.
Giordano.
Cell cycle kinases as therapeutic targets for cancer. Nature Reviews Drug Discovery.
2009;
8
:
547-566
.
-
C.v.
Mering.
STRING: a database of predicted functional associations between proteins. Nucleic Acids Research.
2003;
31
:
258-261
.
-
C.A.
Miller,
S.H.
Settle,
E.P.
Sulman,
K.D.
Aldape,
A.
Milosavljevic.
Discovering functional modules by identifying recurrent and mutually exclusive mutational patterns in tumors. BMC Med Genomics.
2011;
4
:
34
.
-
D.M.
Miller,
S.D.
Thomas,
A.
Islam,
D.
Muench,
K.
Sedoris.
c- Myc and Cancer Metabolism. Clinical Cancer Research.
2012;
18
:
5546-5553
.
-
K.
Mitra,
A.-R.
Carvunis,
S.K.
Ramesh,
T.
Ideker.
Integrative approaches for finding modular structure in biological networks. Nat Rev Genet.
2013;
14
:
719-732
.
-
T.C.G.A.R.
Network.
Erratum: Integrated genomic analyses of ovarian carcinoma. Nature.
2012;
490
:
292-292
.
-
K.T.
Rahman,
M.F.
Islam,
R.S.
Banik,
U.
Honi,
F.S.
Diba,
S.S.
Sumi,
S.M.T.
Kabir,
M.S.
Akhter.
Changes in protein interaction networks between normal and cancer conditions: Total chaos or ordered disorder?. Network Biology.
2013;
3
:
15
.
-
A.W.
Rives,
T.
Galitski.
Modular organization of cellular networks. Proceedings of the National Academy of Sciences.
2003;
100
:
1128-1133
.
-
T.
Rolland,
M.
Taşan,
B.
Charloteaux,
S.J.
Pevzner,
Q.
Zhong,
N.
Sahni,
S.
Yi,
I.
Lemmens,
C.
Fontanillo,
R.
Mosca.
A proteome-scale map of the human interactome network. Cell.
2014;
159
:
1212-1226
.
-
M.
Shackleton,
E.
Quintana,
E.R.
Fearon,
S.J.
Morrison.
Heterogeneity in Cancer: Cancer Stem Cells versus Clonal Evolution. Cell.
2009;
138
:
822-829
.
-
P.
Shannon.
Cytoscape: A Software Environment for Integrated Models of Biomolecular Interaction Networks. Genome Research.
2003;
13
:
2498-2504
.
-
H.
Skomedal,
G.B.
Kristensen,
A.K.
Lie,
R.
Holm.
Aberrant Expression of the Cell Cycle Associated Proteins TP53, MDM2, p21, p27, cdk4, Cyclin D1, RB, and EGFR in Cervical Carcinomas. Gynecologic Oncology.
1999;
73
:
223-228
.
-
M.E.
Smoot,
K.
Ono,
J.
Ruscheinski,
P.L.
Wang,
T.
Ideker.
Cytoscape 2.8: new features for data integration and network visualization.. Bioinformatics.
2010;
27
:
431-432
.
-
C.
Sonnenschein,
A.M.
Soto,
A.
Rangarajan,
P.
Kulkarni.
Competing views on cancer. J Biosci.
2014;
39
:
281-302
.
-
S.
Srihari,
M.A.
Ragan.
Systematic tracking of dysregulated modules identifies novel genes in cancer. Bioinformatics.
2013;
29
:
1553-1561
.
-
A.
Stevens,
S.
Meyer,
D.
Hanson,
P.
Clayton,
R.
Donn.
Network analysis identifies protein clusters of functional importance in juvenile idiopathic arthritis. Arthritis Res Ther.
2014;
16
:
R109
.
-
J.
Sun,
Z.
Zhao.
A comparative study of cancer proteins in the human protein-protein interaction network. BMC Genomics.
2010;
11
:
S5
.
-
M.
Szalay-Beko,
R.
Palotai,
B.
Szappanos,
I.A.
Kovacs,
B.
Papp,
P.
Csermely.
ModuLand plug-in for Cytoscape: determination of hierarchical layers of overlapping network modules and community centrality. Bioinformatics.
2012;
28
:
2202-2204
.
-
W.P.
Tansey.
Mammalian MYC Proteins and Cancer. New Journal of Science.
2014;
2014
:
1-27
.
-
C.G.
Willett,
D.T.
Chang,
B.G.
Czito,
J.
Meyer,
J.
Wo.
Cancer Genome Atlas Network. Comprehensive molecular characterization of human colon and rectal cancer. Nature 2012.(5). International Journal of Radiation Oncology Biology Physics.
2013;
86
:
2
.
-
Y.
Zhang,
S.M.
Luoh,
L.S.
Hon,
R.
Baertsch,
W.I.
Wood,
Z.
Zhang.
GeneHub-GEPIS: digital expression profiling for normal and cancer tissues based on an integrated gene database. Nucleic Acids Research.
2007;
35
:
W152-W158
.
Comments
Downloads
Article Details
Volume & Issue : Vol 3 No 04 (2016)
Page No.: 605-615
Published on: 2016-04-15
Citations
Copyrights & License
This work is licensed under a Creative Commons Attribution 4.0 International License.
Search Panel
Pubmed
Google Scholar
Pubmed
Google Scholar
Pubmed
Google Scholar
Pubmed
Google Scholar
Pubmed
Search for this article in:
Google Scholar
Researchgate
- HTML viewed - 4534 times
- Download PDF downloaded - 888 times
- Supplement downloaded - 0 times
- View Article downloaded - 10 times
